

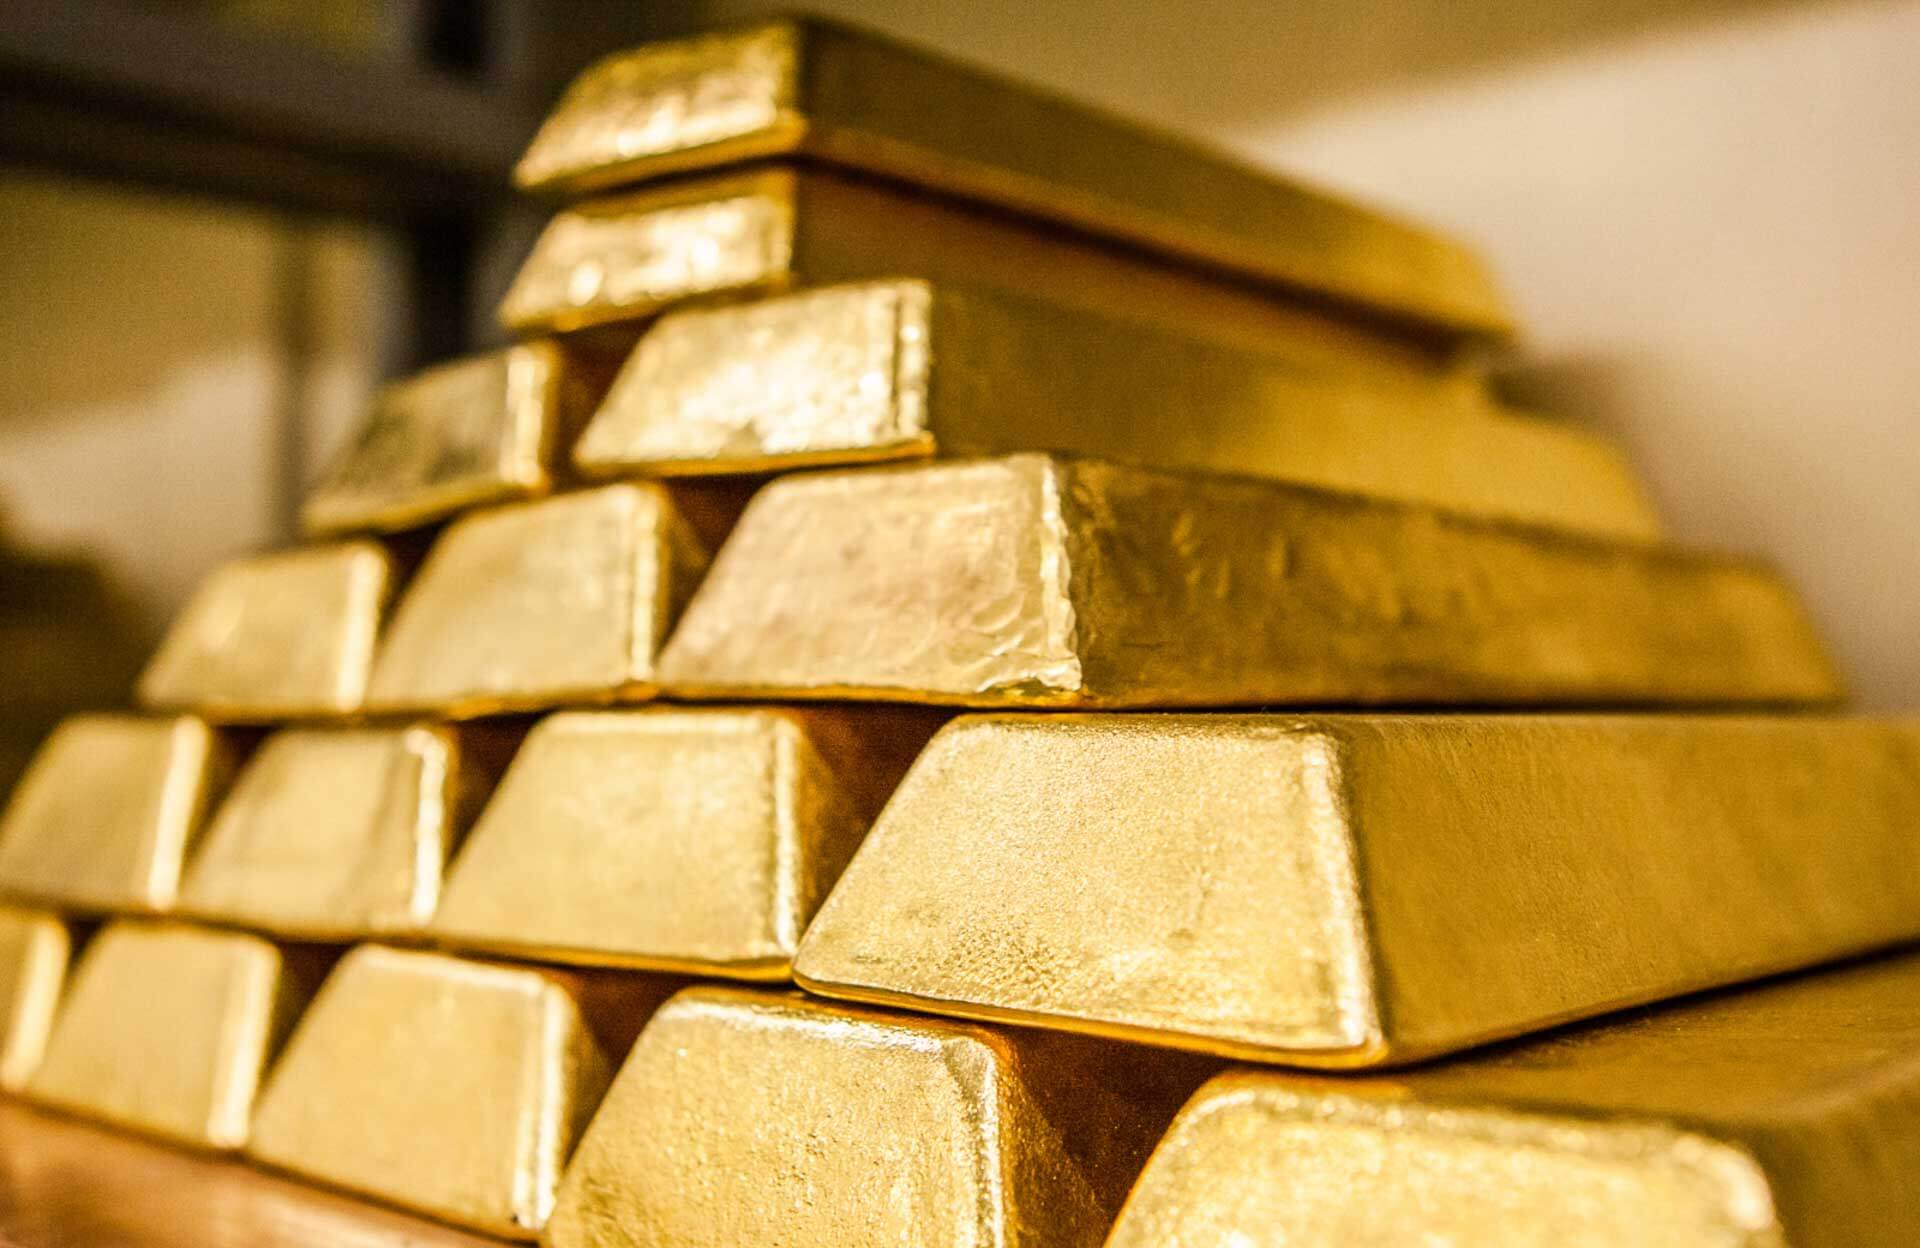

Gold continues its September sell-off. An ounce is currently trading below $4,270, representing its lowest level in five weeks. The precious metal has lost nearly 9% relative to its August peak, with September alone bringing a drop of over 3%.
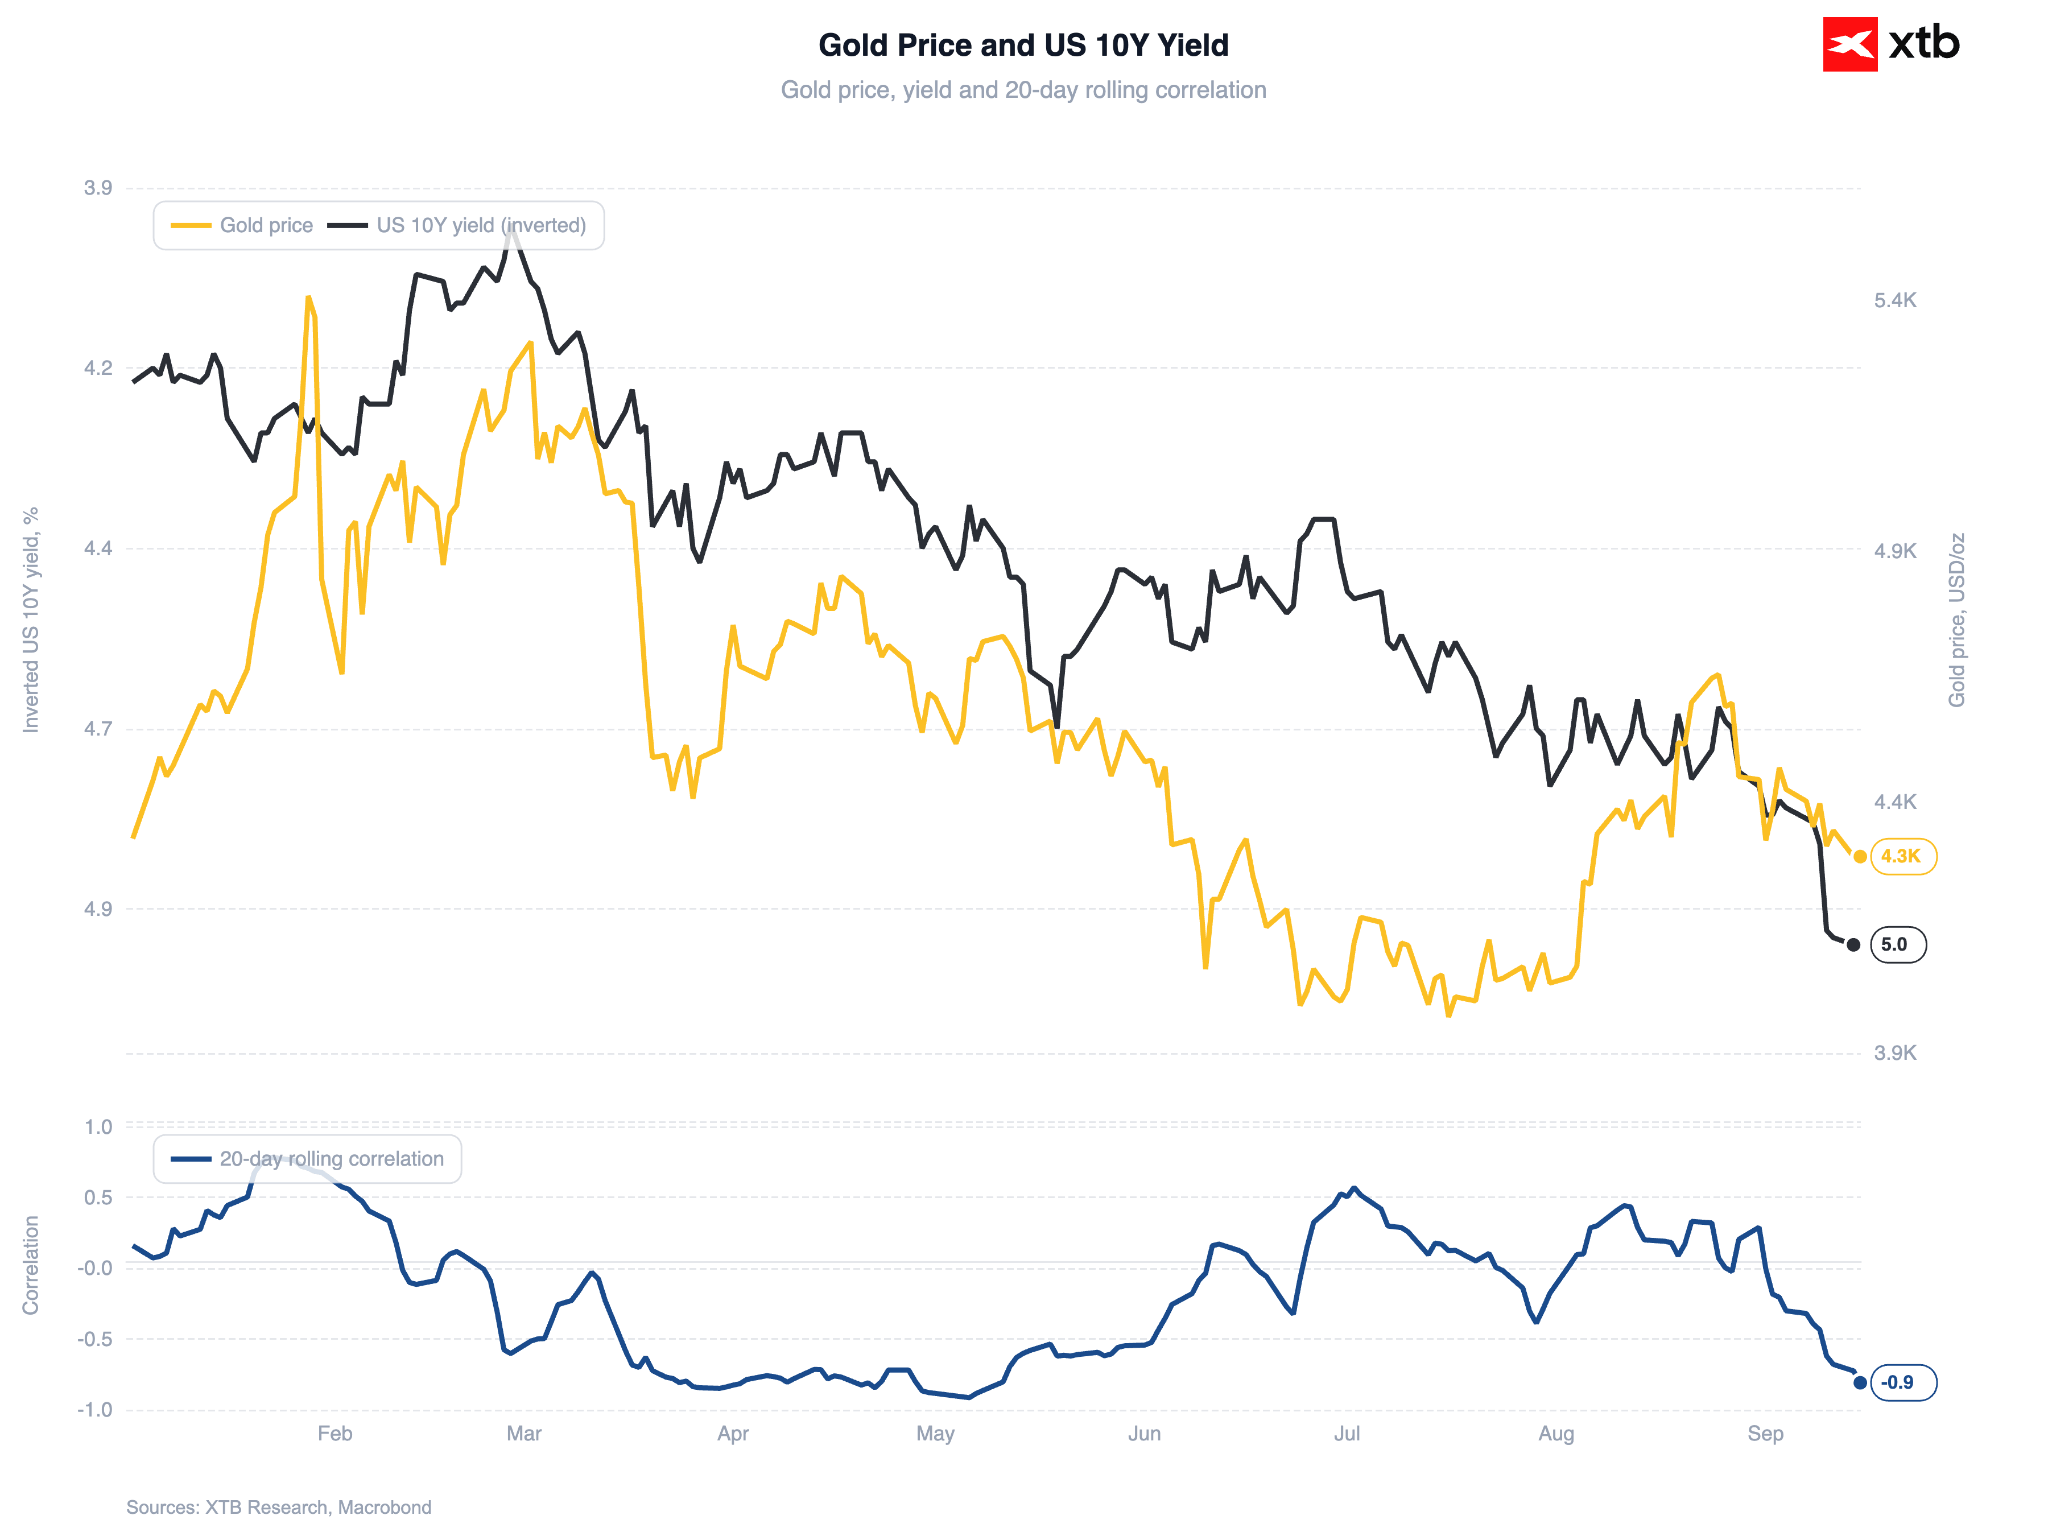
Figure 1: Gold and US 10-Year Treasury Yield [Inverted Axis] (2026)
 Source: XTB Research, 15.09.2026
Oil and yields weigh on precious metals
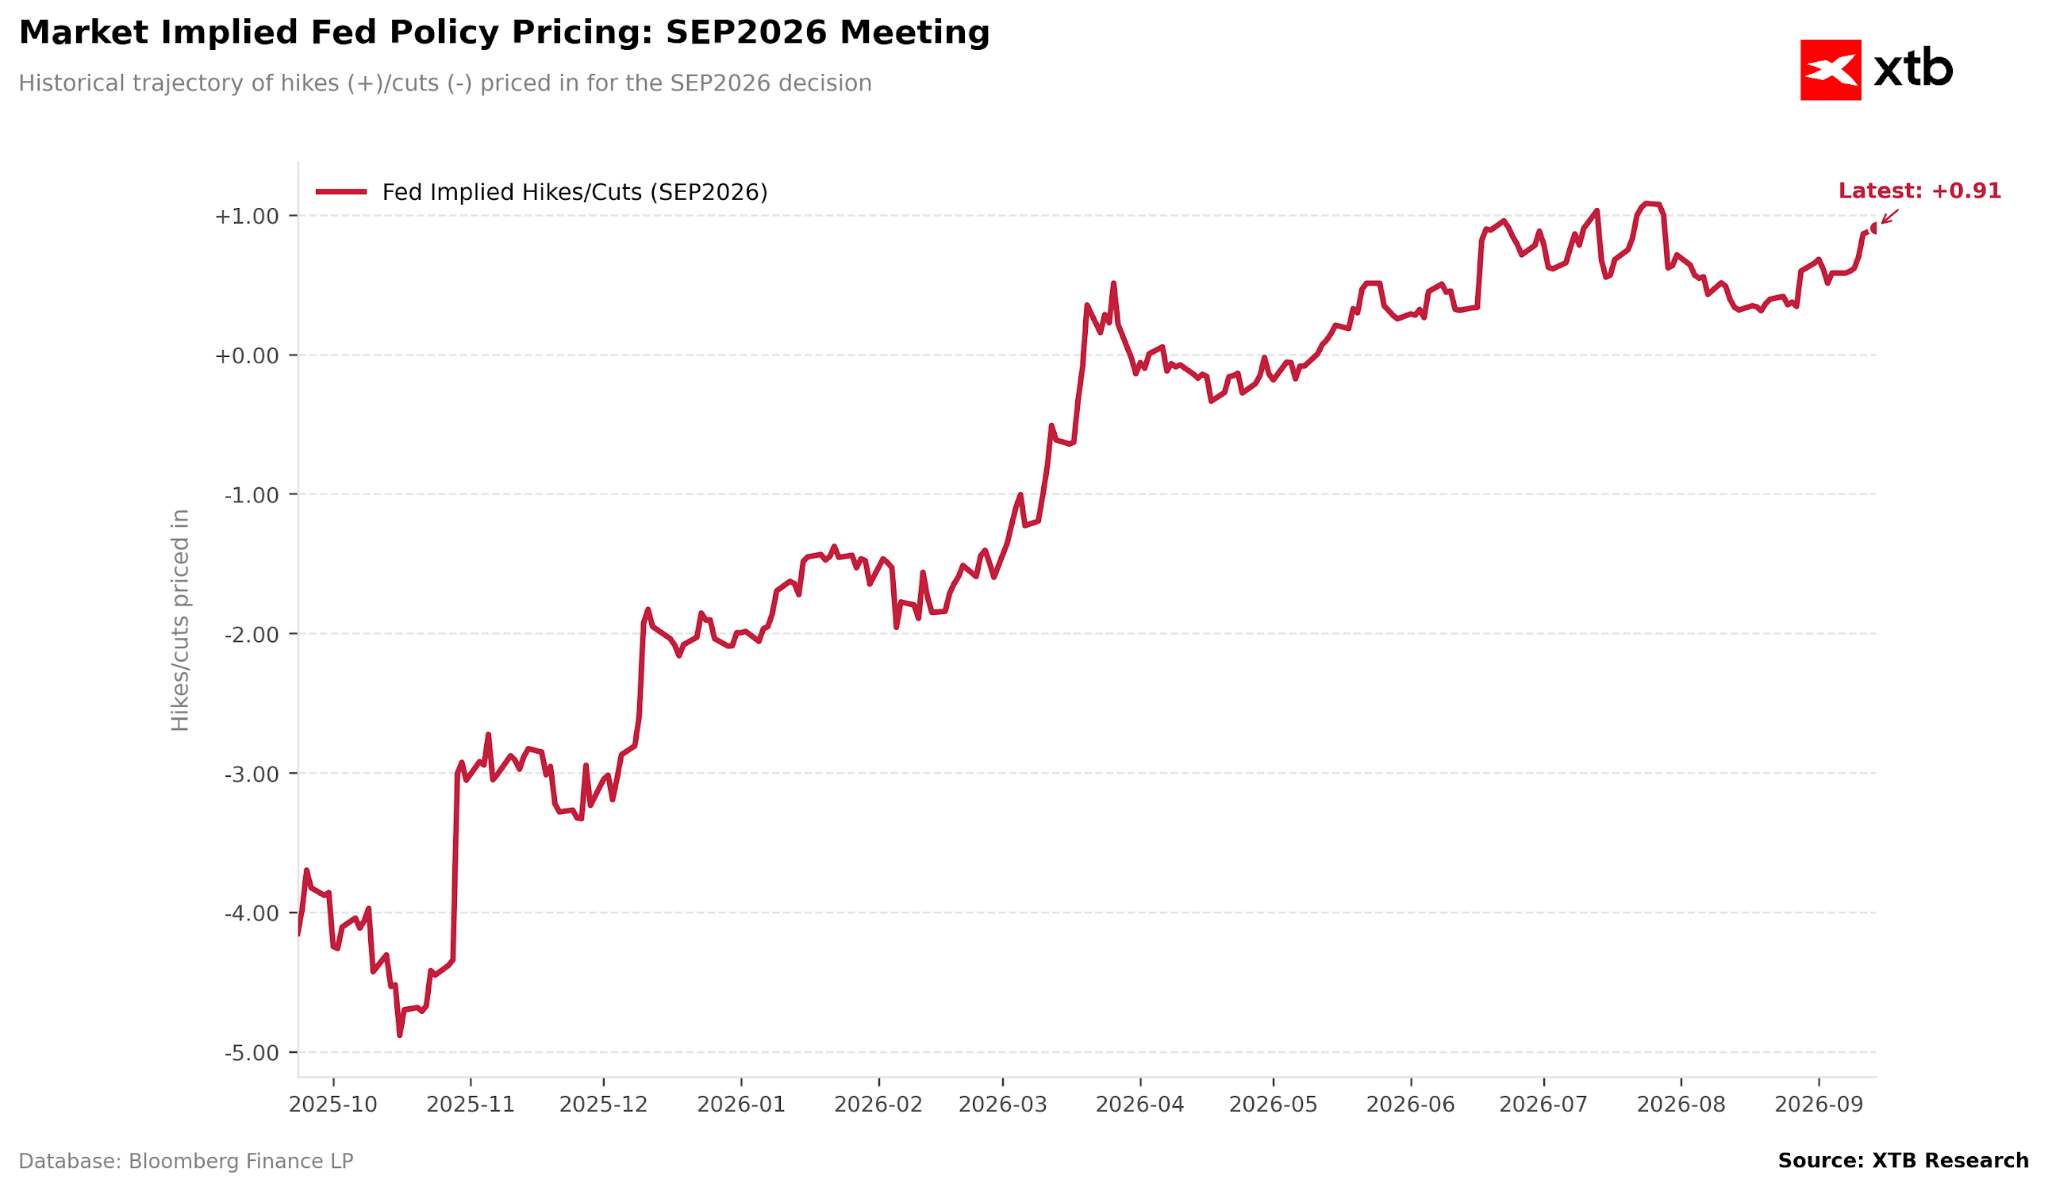
The primary driver of the sell-off remains rising expectations of interest rate hikes in the US. The market is currently pricing in a 92% probability of a rate increase at Wednesday's FOMC meeting, which would mark the first rate hike in three years.
The catalyst for this hawkish repricing came from recent inflation data and an escalation in the oil market; following the temporary shutdown of the East-West pipeline by Saudi Arabia, Brent crude breached the $108 per barrel mark. September's price increase has now reached nearly 20%.
Rising energy costs are fuelling inflation concerns, which, combined with growing public debt, is pushing the yield on US 10-year Treasury bonds to levels not seen in nearly two decades (5.04%, the highest since 2007). Higher yields traditionally act as a headwind for gold, which yields no interest.
Demand from funds and central banks remains stable
Interestingly, the price decline is accompanied by a recovery in assets under management in gold ETFs, which are returning towards pre-July trough levels. Meanwhile, central banks, according to World Gold Council data, remain in reserve accumulation mode. Therefore, the drop in prices does not appear to stem from an outflow of long-term demand, but rather from short-term market positioning ahead of a Fed rate hike.
Harmony Gold mine accident in the background
An additional, though currently secondary, factor for the market is a tragic accident at the Mponeng mine, owned by Harmony Gold in South Africa. Following a seismic event in the underground workings, a worker lost their life, and operations have been suspended pending an investigation by the relevant authorities. Mponeng is one of the deepest gold mines in the world; potential prolonged outages could impact global bullion supply over the longer term, although at present the market is not pricing this in as a material factor for prices.
Awaiting the Fed decision
In the coming days, the Fed meeting will be crucial for gold and other precious metals. Indications suggest that the first interest rate hike since July 2023 could take place on Wednesday at 7:00 PM.
For a long time, there were doubts over whether the committee would indeed decide on such a move, particularly given the ambiguous communication from the new chair, Kevin Warsh. Currently, however, markets are pricing it in at over 90%.
Figure 2: Change in Market-Implied Probability of September Fed Rate Hike (2025 - 2026)
 Source: XTB Research, 15.09.2026
A pause could be interpreted as the Fed giving in to pressure from Donald Trump, who has been vocal in advocating for lower rates. This would likely result in a further rise in long-term bond yields and a resurgence of the debasement trade, a strategy involving a shift away from fiat currencies towards hard assets with capped supply, including precious metals and Bitcoin. This would certainly not be positive news for the US dollar, which has enjoyed a relatively successful period.
Technical Analysis
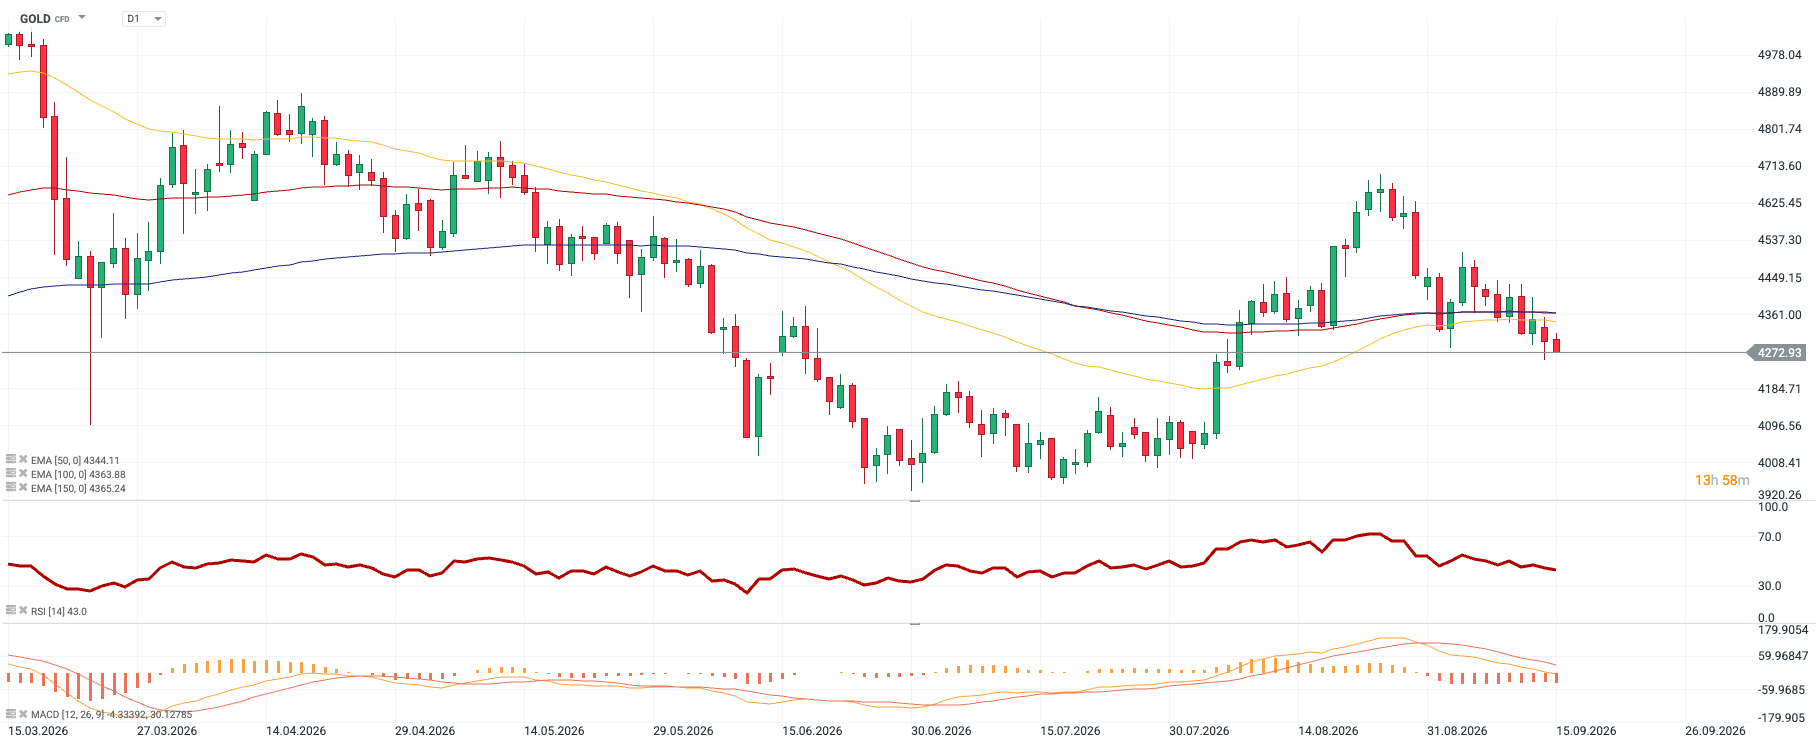
Figure 3: GOLD [D1] (15.03.2026 - 15.09.2026)
Source: xStation, 15.09.2026
Gold prices have fallen below all three exponential moving averages (EMA 50, 100, and 150), which are currently converging in a narrow band between $4,344 and $4,365, forming a resistance zone. Price previously managed to bounce off this moving average cluster in August and rally towards $4,700, but the move proved unsustainable and was completely unwound in September. The current price level coincides with prior support from late July and early August, making this zone critical for the next directional move; a decisive breakdown would open the path towards the June-July lows in the $4,000 area.
The RSI stands at a neutral 43 level, comfortably away from oversold territory. The MACD histogram remains in negative territory, with the MACD line sitting below the signal line and signaling no immediate trend reversal. Thus, the technical picture remains aligned with the fundamentals: until there is a shift in the narrative surrounding oil prices and Fed monetary policy, the advantage remains firmly with the bears.



Oil falls below $100🚨


💶Chart of the Day: EURUSD at Lowest Since May 2025 Amid French Fiscal Crisis

Morning Briefing: Dollar gains, oil falls. EURUSD at multi-month lows



Morning Wrap: Tech Rally in Asia Following Micron Results and Weakening Yen Despite Hawkish BoJ