
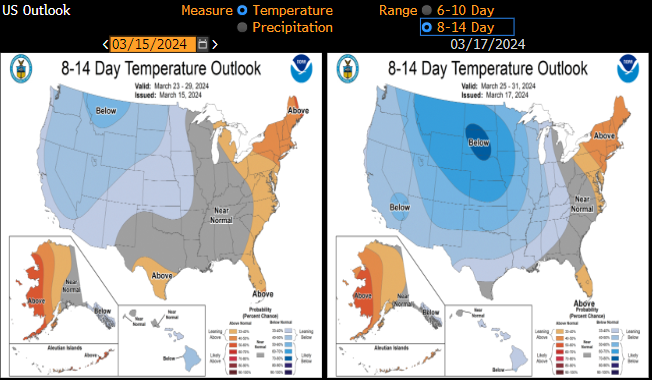
US natural gas prices (NATGAS) launched new week's trading with a bullish price gap and continued to gain during the Asia-Pacific session. The move looks to be triggered by new weather forecasts for the United States. While winter heating season in the United States, which runs from October until the end of March, is almost over, new 8-14 day forecasts point to below-average temperatures across the US mainland, including in key heating regions. This suggests that demand for power, and in turn for natural gas, may increase in the coming days. While pre-weekend forecasts also pointed to below-average temperatures, they are now seen across a broader part of the US mainland.
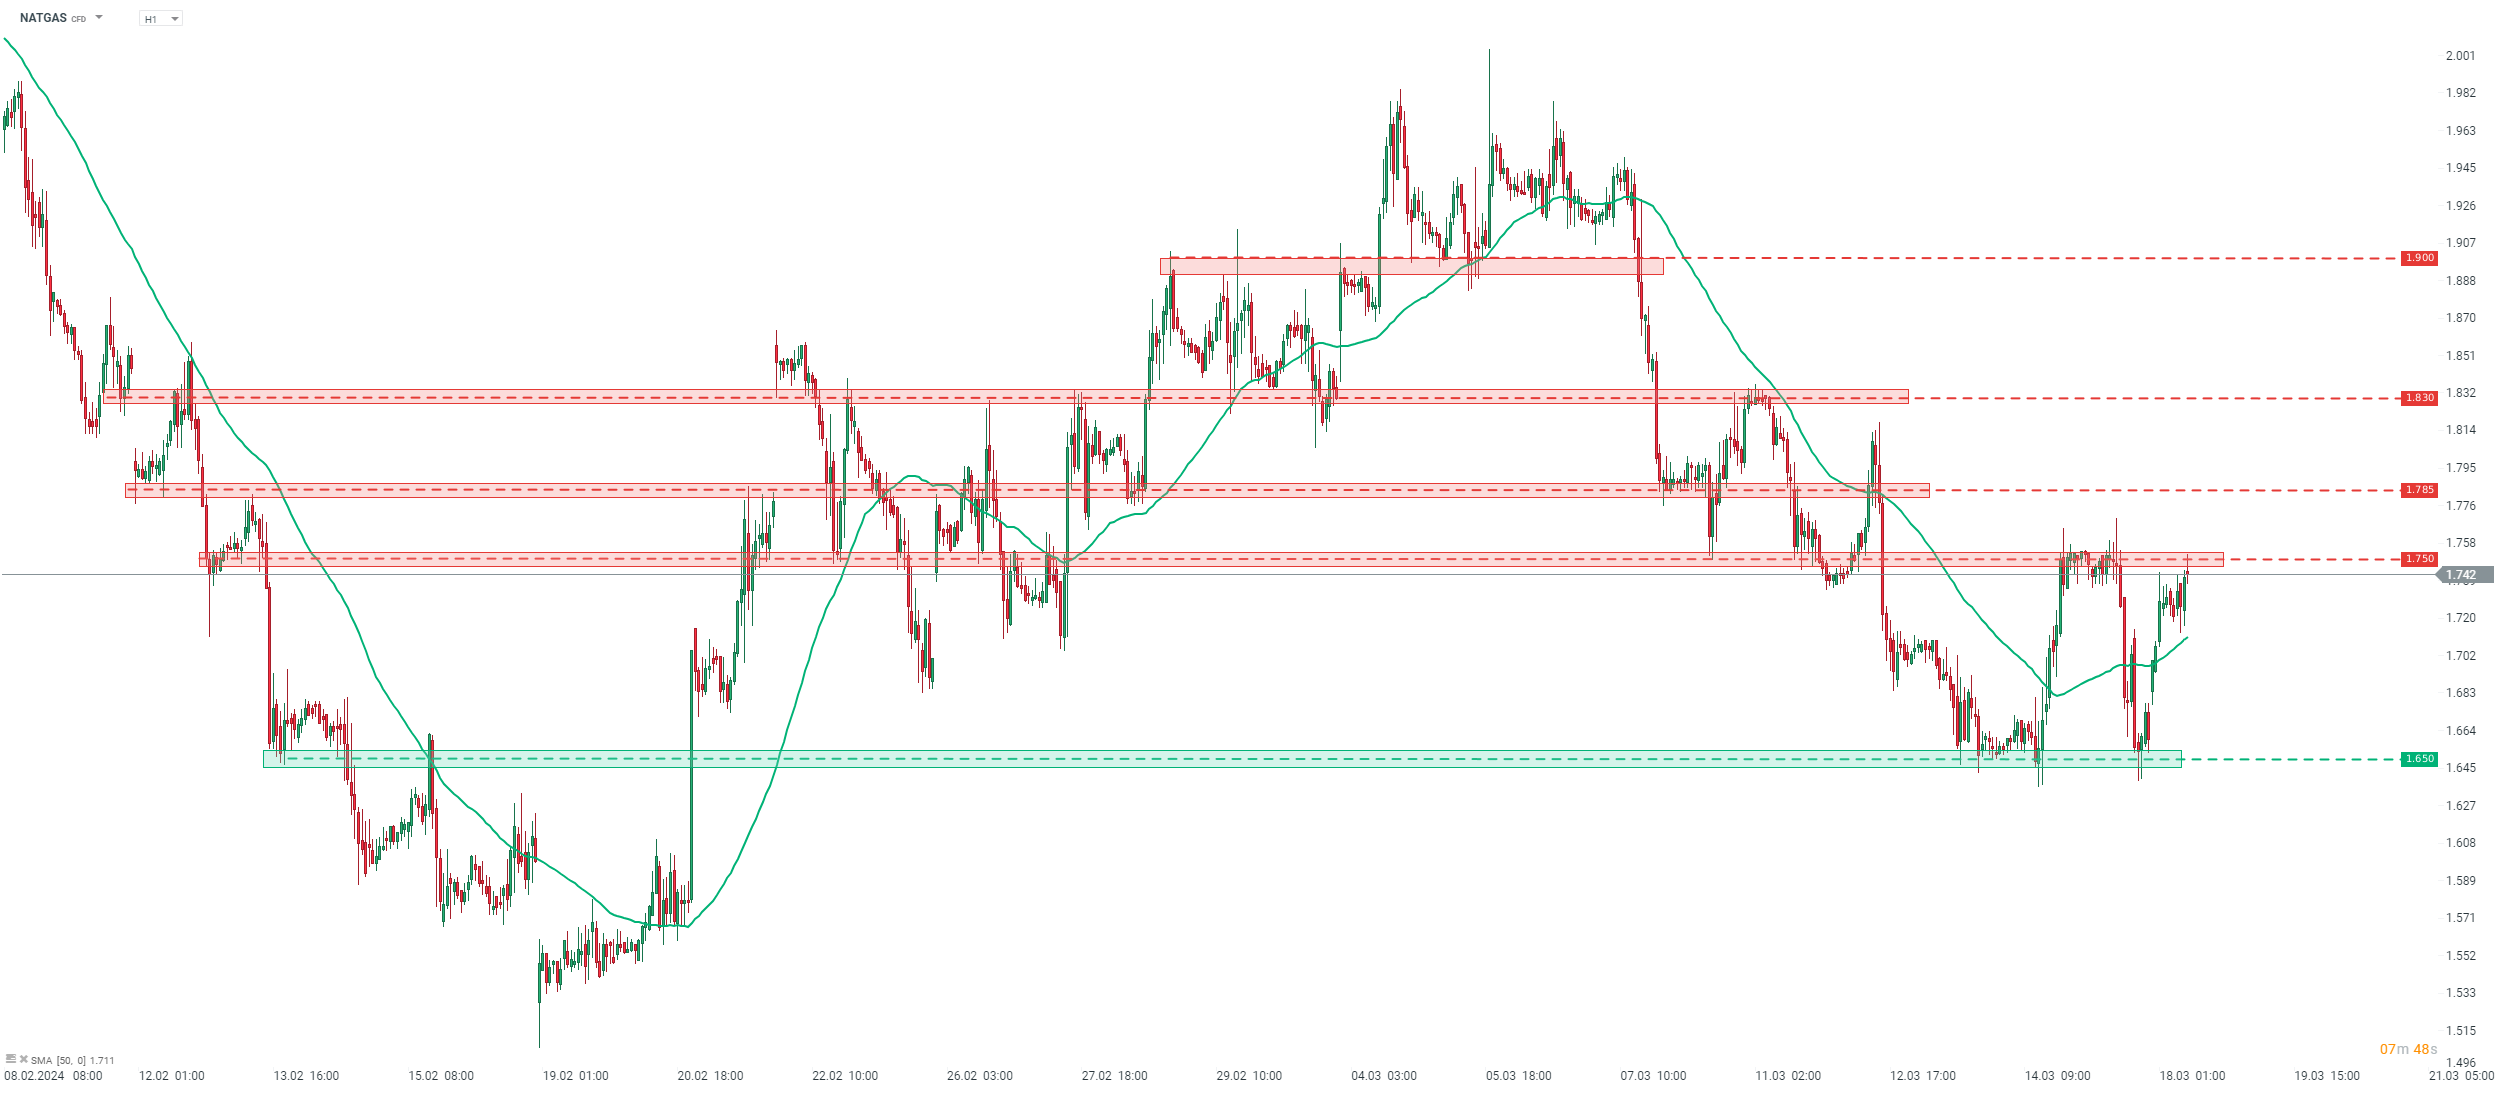
Taking a look at NATGAS chart at H1 interval, we can see that the price bounce off the 1.65 support zone and climbed to the 1.75 resistance, marked with local highs from Thursday and Friday last week. This area is being tested at press time. A break above would pave the way for a test of the 1.785 area.
Source: xStation5
Source: Bloomberg Finance LP, NOAA

Morning Wrap: What’s next with the Strait of Hormuz, inflation and US interest rates? (15.07.2026)

Daily Summary: Lower inflation weakens the dollar and awakens gold and S&P 500 to gains

Bypassing Hormuz: Gulf States Race Against Time

Market Wrap: Europe slips on Ormuz escalation, market awaits US CPI