
Q2 GDP report from New Zealand turned out to be a big positive surprise. Market expected that the New Zealand economy grew by 1.4% quarter-over-quarter in the April-June period. However, actual data showed a growth rate of 2.8% QoQ. Data may seem outdated but it is another argument for a RBNZ rate hike. There were expectations that RBNZ will hike rates at the meeting in August but new lockdowns made central bankers stay on hold. Next meeting is scheduled for October 6, 2021.
Taking a look at the NZDUSD chart at H1 interval, we can see that the pair rallied following release of the GDP report last night (orange circle). However, upward move was halted near the downward trendline and the pair started to lose ground as the US dollar strengthened. This drop has stopped near the 50-hour moving average, at least for now. In a broad picture, NZDUSD trades in a descending triangle pattern. Direction of the break from the pattern should determine the next large move. The pair may become more active near 1:30 pm BST today when US retail sales report is released.
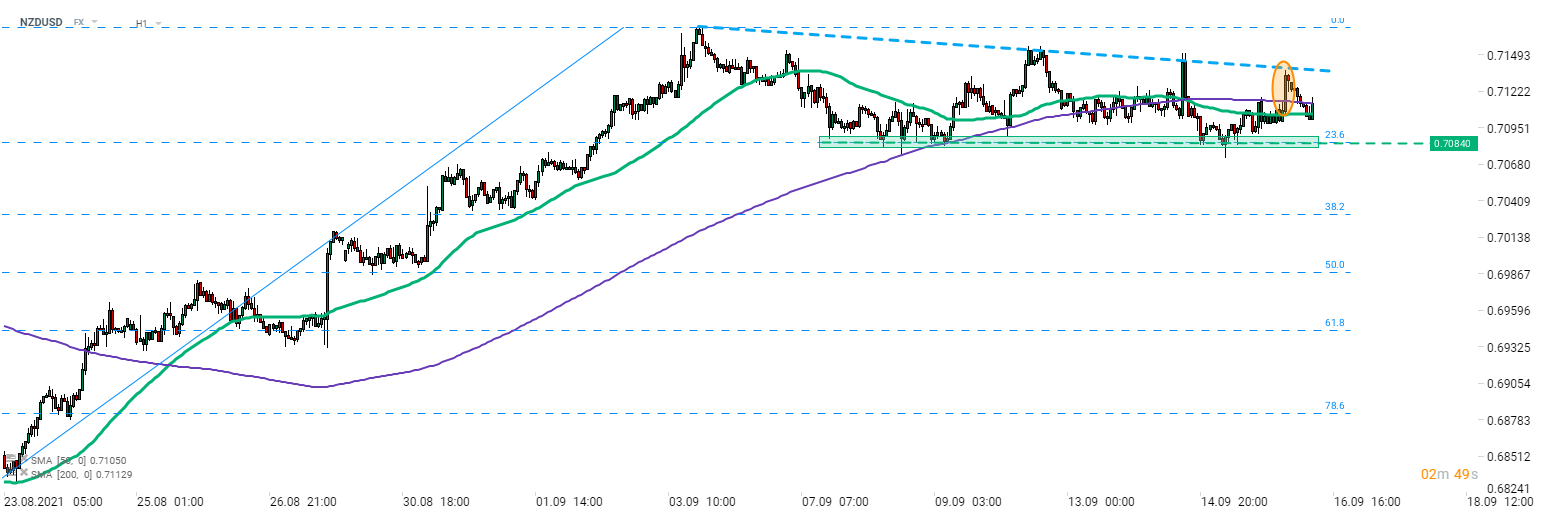 Source: xStation5

🔴European TTF gas prices fall by 7.5%

Daily Summary: Equities Diverge as Tech Lags, Europe Rallies on Earnings & PMIs (24.07.2026)

Three markets to watch next week (24.07.2026)

BREAKING: Eurozone recovery? Positive PMI data tempered by high oil and gas prices