
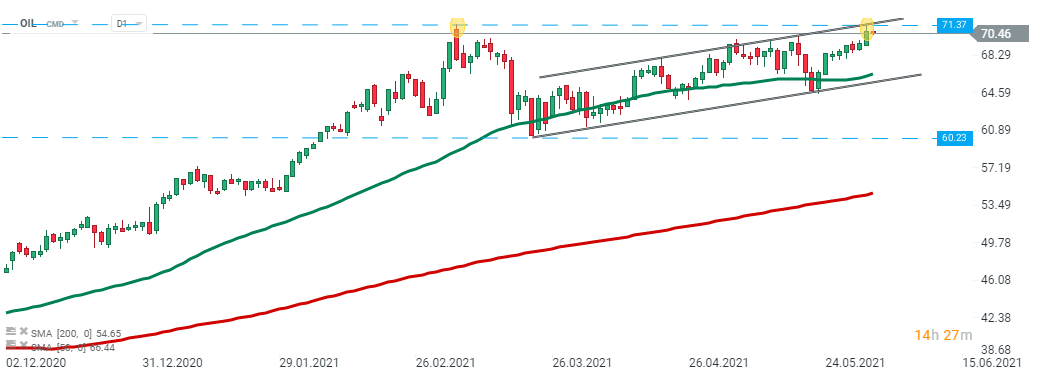
Brent prices (OIL) broke above major resistance at $70 a barrel during yesterday's session, reaching the highest levels since early-March as OPEC+ agreed to keep to their plan to gradually ease supply curbs through July. At the same time, market participants were upbeat that fuel demand will grow in the coming months as the US summer driving season gets underway. However later in the session buyers failed to break above the resistance at 71.37 which coincides with the upper limit of the ascending channel and price pulled back to the $70 mark which now acts as key short-term support. Looking at the daily time frame one can notice that the potential double top formation appeared on the chart, signaling a risk of a bigger downward move.
 OIL, D1 interval. Source: xStation

Morning Wrap: Markets Are Trying to Rebound Following Big Tech Earnings and the Fed's Decision

Daily Summary - The market starts to doubt rate hikes after Warsh, but Trump destroys the rebound

Strong Sell-off in Coffee and Cocoa

⚫Massive Drop in US Oil Inventories Further Fuels Prices