
Pullback on the oil market continues with Brent nearing $100 per barrel today and WTI trading near $97 per barrel. A pullback on the oil market was initially reasoned with more optimistic comments on Russia-Ukraine talks. However, the real reason behind the move may be different. China is facing a resurgence of Covid pandemic. China reported 5,280 new Covid cases compared to 1,437 a day ago. As the country chose a zero-tolerance policy to combat Covid, lockdowns were already reimposed in some cities. Having said that, the ongoing drop in oil prices may be driven by an expected demand destruction in China.
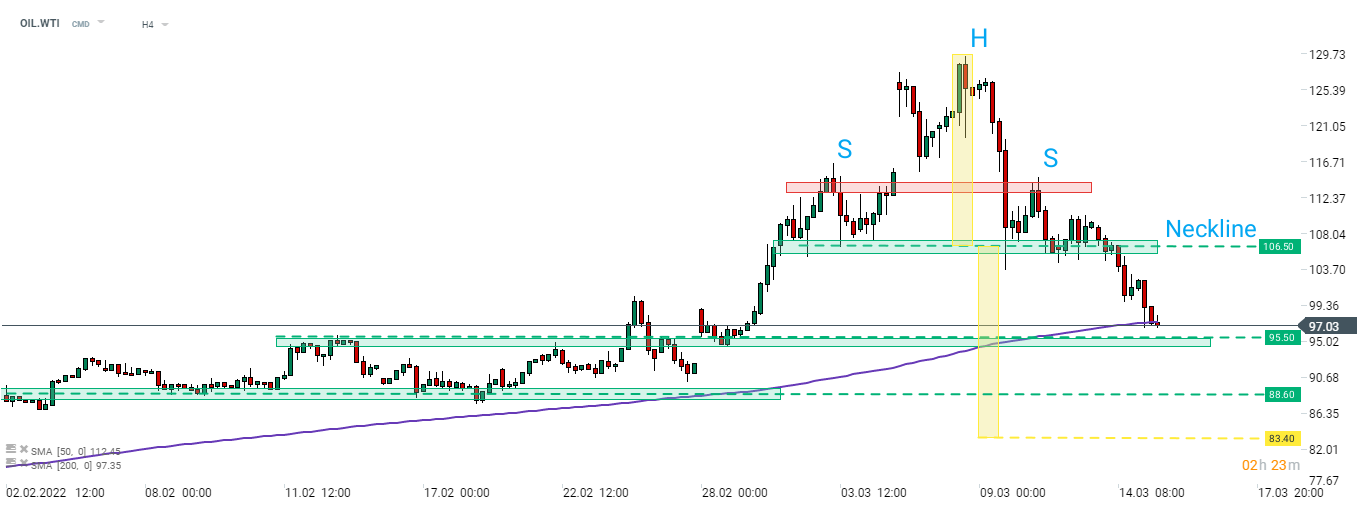
What does the chart tell us? Taking a look at OIL.WTI at H4 interval, we can see that a head and shoulders pattern was painted on the chart. Price broke below the neckline of the pattern at $106.50 and downward move accelerated later on. A 200-period moving average (purple line) is being tested at press time. A break below this moving average may pave the way for a test of the mid-term support in the $95.50 area. An ultimate target for sellers is $88.60 area, marked with a textbook range of a breakout from the aforementioned head and shoulders pattern.
 Source: xStation5

Morning Wrap: Asia dips on SK Hynix earnings and Iranian attacks! Dollar stalls before Fed (29.07.2026)

The coffee market in the grip of weather and empty warehouses: The paradox of record Brazil harvests

Chart of the Day: Who suffers from the oil price drop? (28.07.2026)

Economic Calendar: PayPal, Visa and Coca-Cola to overshadow macro data (28.07.2026)