
Nasdaq-100 (US100) had a very volatile session yesterday. The index has been trading lower during the European session and experienced a steep drop after the launch of a cash trading session on Wall Street. Tech index was trading 2.8% lower shortly after the beginning of the Wall Street session. However, a strong reversal occurred later on and losses were erased. As a result, a bullish candlestick was painted on a daily interval near an important price zone.
Taking a look at US100 chart at D1 interval, we can see that the index was making a third attempt of breaking below the 15,600 pts resistance zone yesterday and it looked like it may succeed this time. However, the index erased losses and climbed back to the aforementioned price zone following a strong recovery. A long, lower wick of yesterday's daily candlestick suggests that bull camp below the 15,600 pts is strong and recovery move may follow now. The nearest resistance zone to watch can be found in the 16,400 pts area. On the other hand, should sellers regain control over the market and push the index below 15,600 pts area, the next support level to watch can be found at 14,975 pts, where the lower limit of Overbalance structure and 200-session moving average can be found.
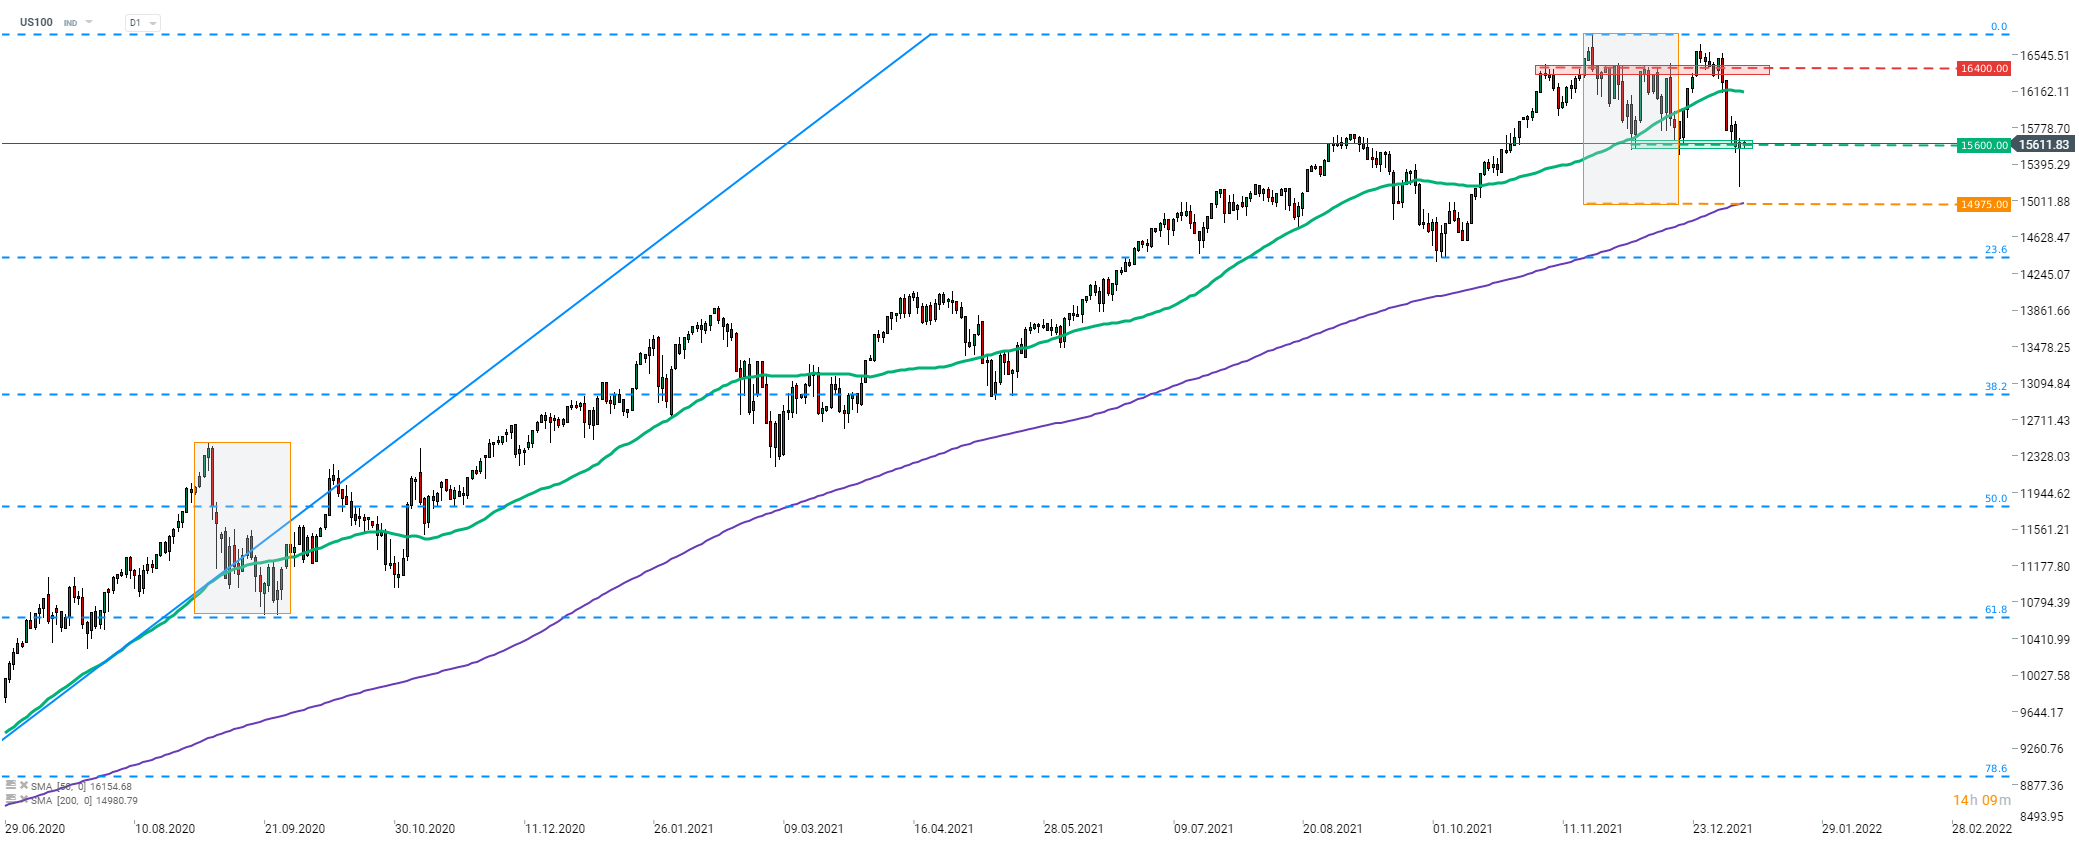
Source: xStation5

Daily Summary: Equities Diverge as Tech Lags, Europe Rallies on Earnings & PMIs (24.07.2026)

Three markets to watch next week (24.07.2026)

US OPEN: Nasdaq hits 1-month low! Geopolitics bring AI trade down!

Market Wrap: European Stocks Are Trying to Rebound as the Week Comes to an End💡