
Dow Jones, S&P 500 and Nasdaq-100 pulled back from record highs yesterday. Russell 2000 (US2000) was a top laggard on Wall Street yesterday, dropping 1.36%. However, US small-cap index has been underperforming other Wall Street indices for some time already as it has reached a record high in mid-March and failed to paint a new one since. A head and shoulders pattern can be spotted on the chart with a shoulderline at 2,300 pts and neckline at 2,135 pts. Note that slightly above the lower limit of market geometry can be found slightly above the neckline. Having said that, breaking below the 2,135 pts area could give a strong technical signal for bears and resulting downward move may reach a potential target of the pattern at 1,910 pts.
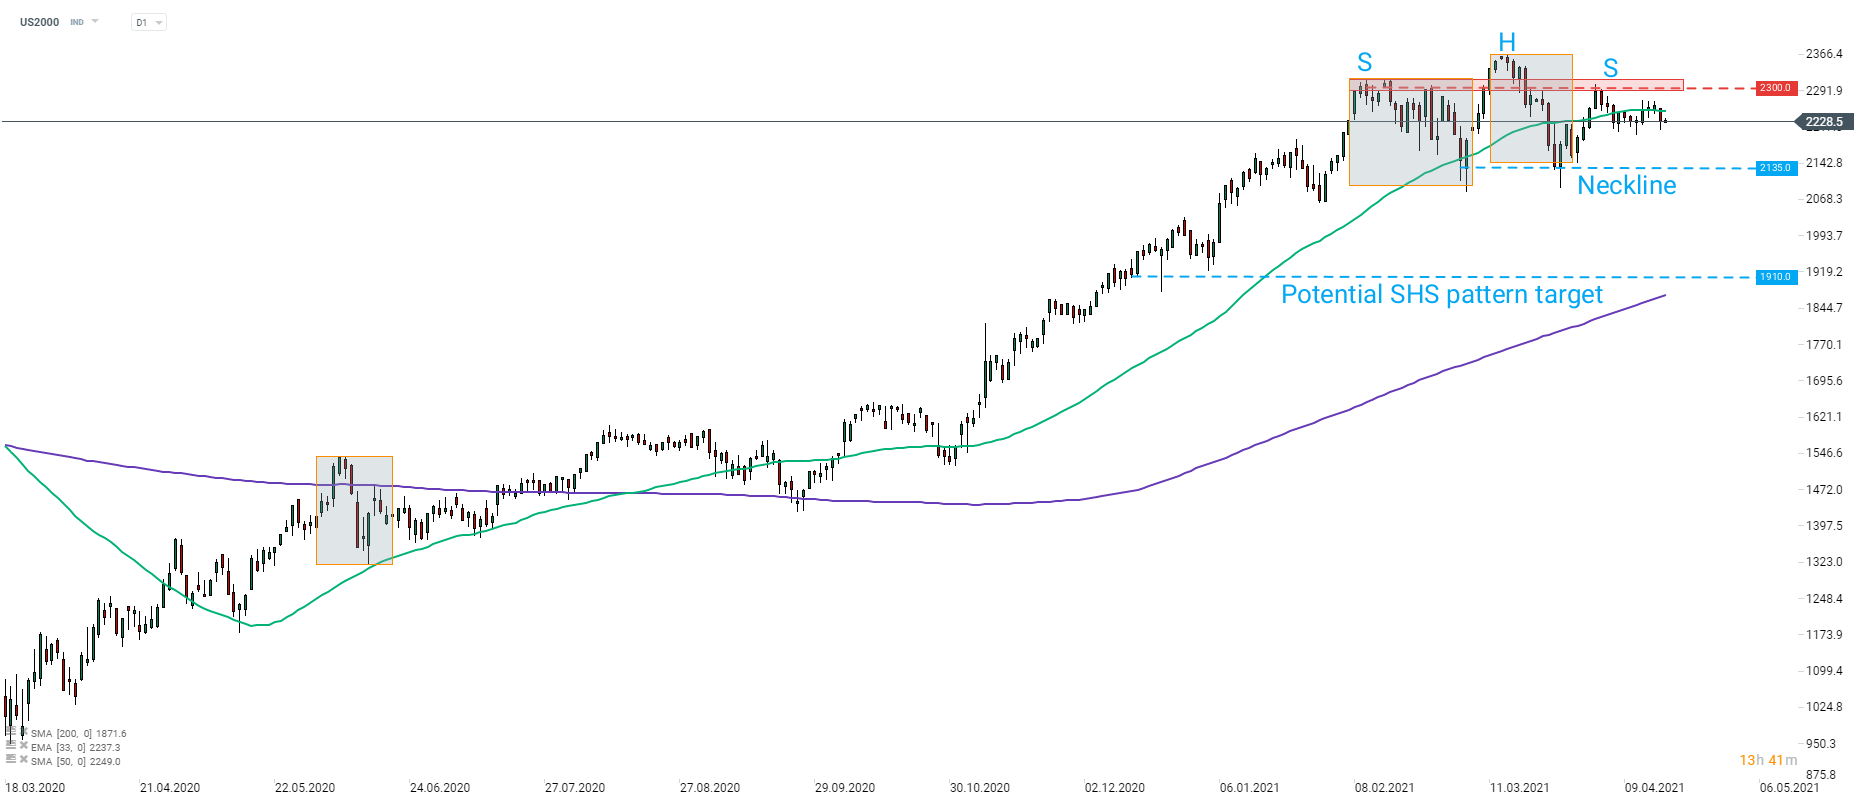 Source: xStation5

Daily Summary: Wall Street Regains Ground; Another Intervention in the Yen Market❓

Three Markets to Watch Next Week (July 31, 2026)

Market Wrap: European equities at 3-week highs! Apple dips in US premarket!

Economic Calendar: Key European CPI Readings and Oil Giants’ Earnings