
USDCHF has broken below the neckline of the head and shoulders pattern recently. According to classic technical analysis, this pattern heralds trend reversal and breaking below the neckline proceeds the final downward impulse. Nevertheless, the sell-off has been halted at the support zone in the 0.9050 area, marked with previous price reactions and exterior 161.8% retracement. Should we see a break below this area, sell-off may accelerate towards the lower limit of the yellow box marked on the chart below (textbook range of the breakout from head and shoulders pattern). On the other hand, should recovery continue, the earlier-broken neckline is the key near-term support to watch.
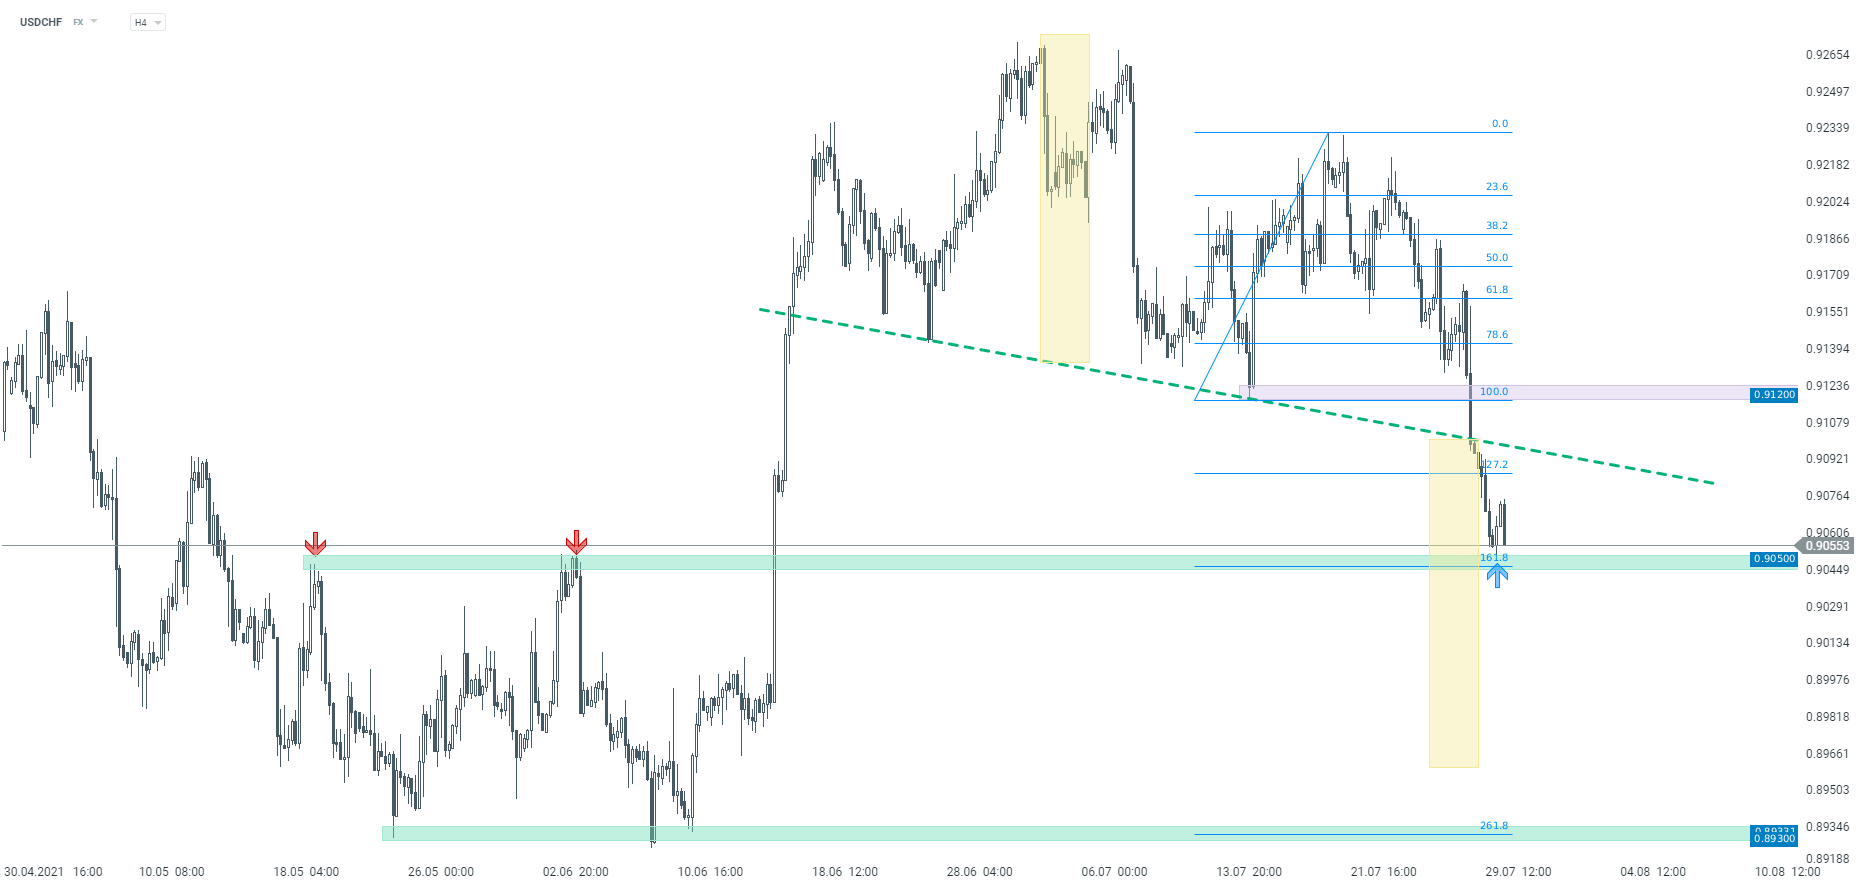 Source: xStation5

Daily Summary: Wall Street Regains Ground; Another Intervention in the Yen Market❓

Three Markets to Watch Next Week (July 31, 2026)

Market Wrap: European equities at 3-week highs! Apple dips in US premarket!

Chart of the Day: EURUSD after the Fed meeting. The market scales back rate hike expectations