Gold
- Gold recorded the highest close in history on Monday and the first one above $2,100 per ounce
- Gold and other precious metals jumped on Friday, following release of weaker-than-expected ISM manufacturing index for February, and upbeat sentiment towards the asset class lasted into the new week
- The move higher is somewhat puzzling and may be partly driven by safe haven flows amid potential troubles in US banking sector. Fitch cut rating of New York Community Bancorp to 'junk' level amid bank's high exposure to commercial real estate sector
- Fed Chair Powell will appear in Congress for semiannual testimonies this week (Wednesday and Thursday)
- However, Fed Chair is unlikely to signal that Fed gained more confidence that inflation is heading back towards the target as data released since January FOMC meeting did not show any major deceleration in price growth
- Lack of such dovish comments may trigger a hawkish reaction in the markets and cause precious metals to trim recent gains
- A large divergence can be spotted between gold price and ETF gold holdings, with ETFs continuing to be net sellers of gold
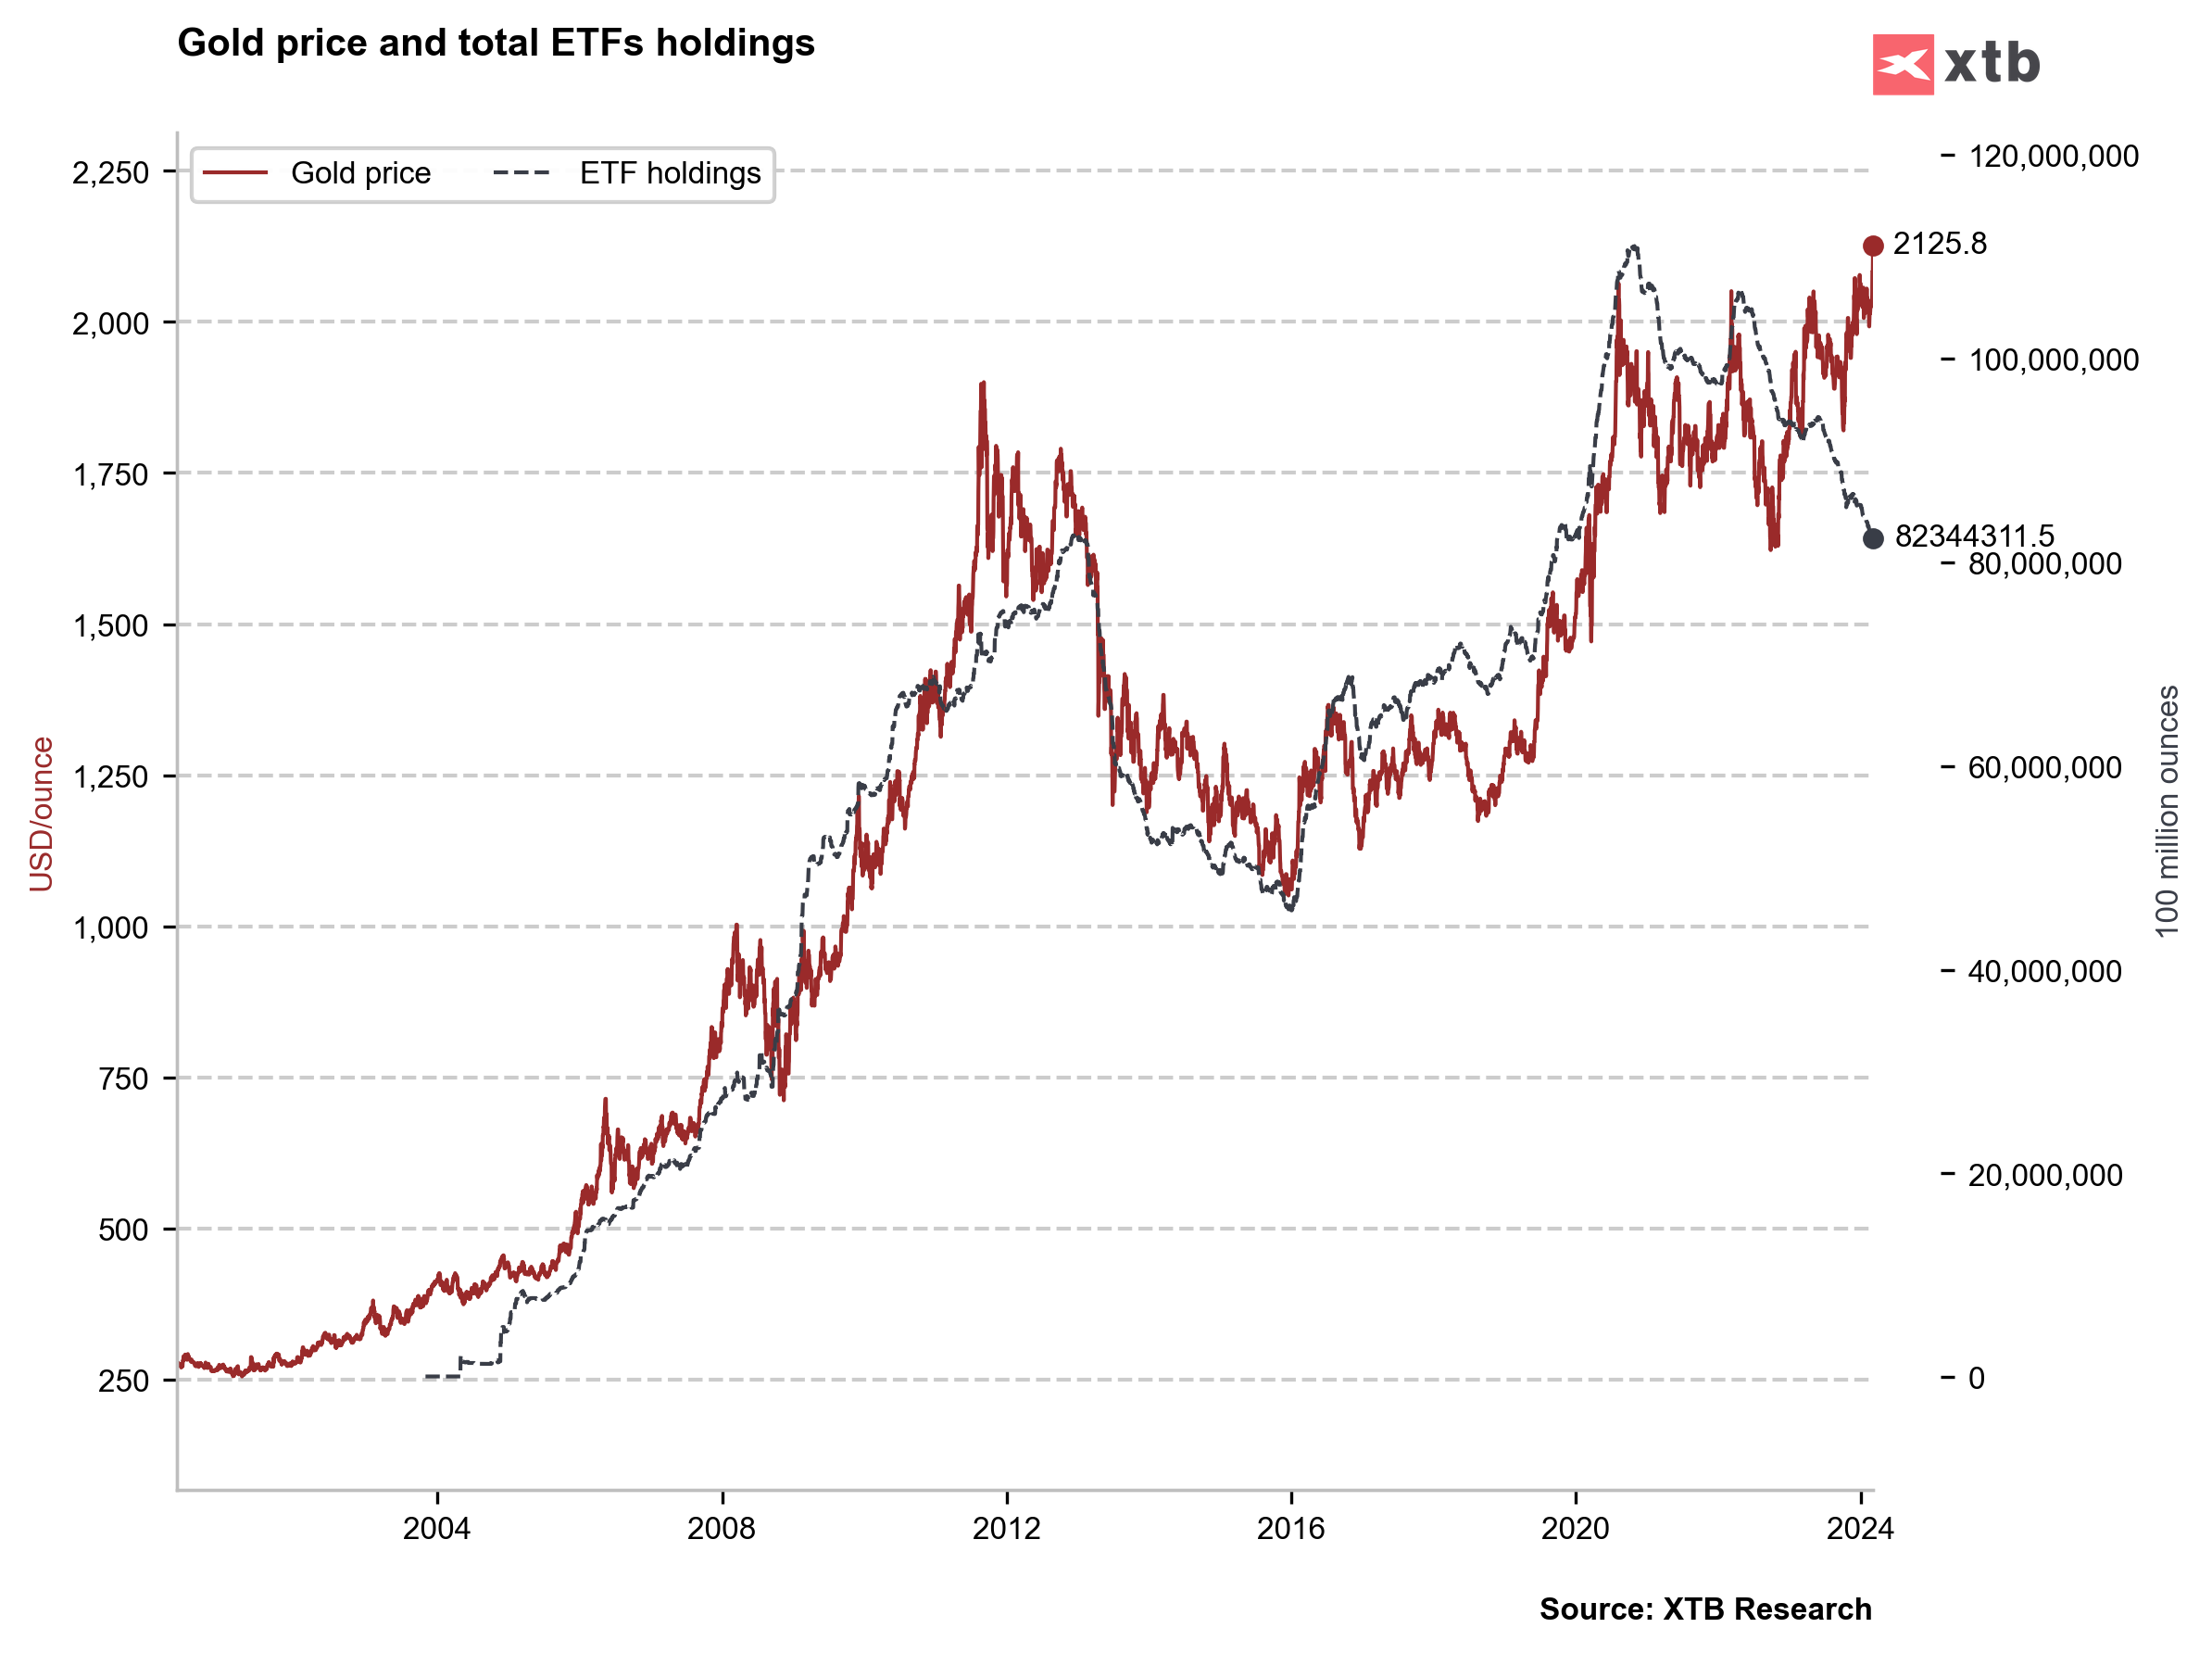
ETFs continue to be net sellers of gold with holdings dropping to the lowest level since the beginning of 2020. Source: Bloomberg Finance LP, XTB Research
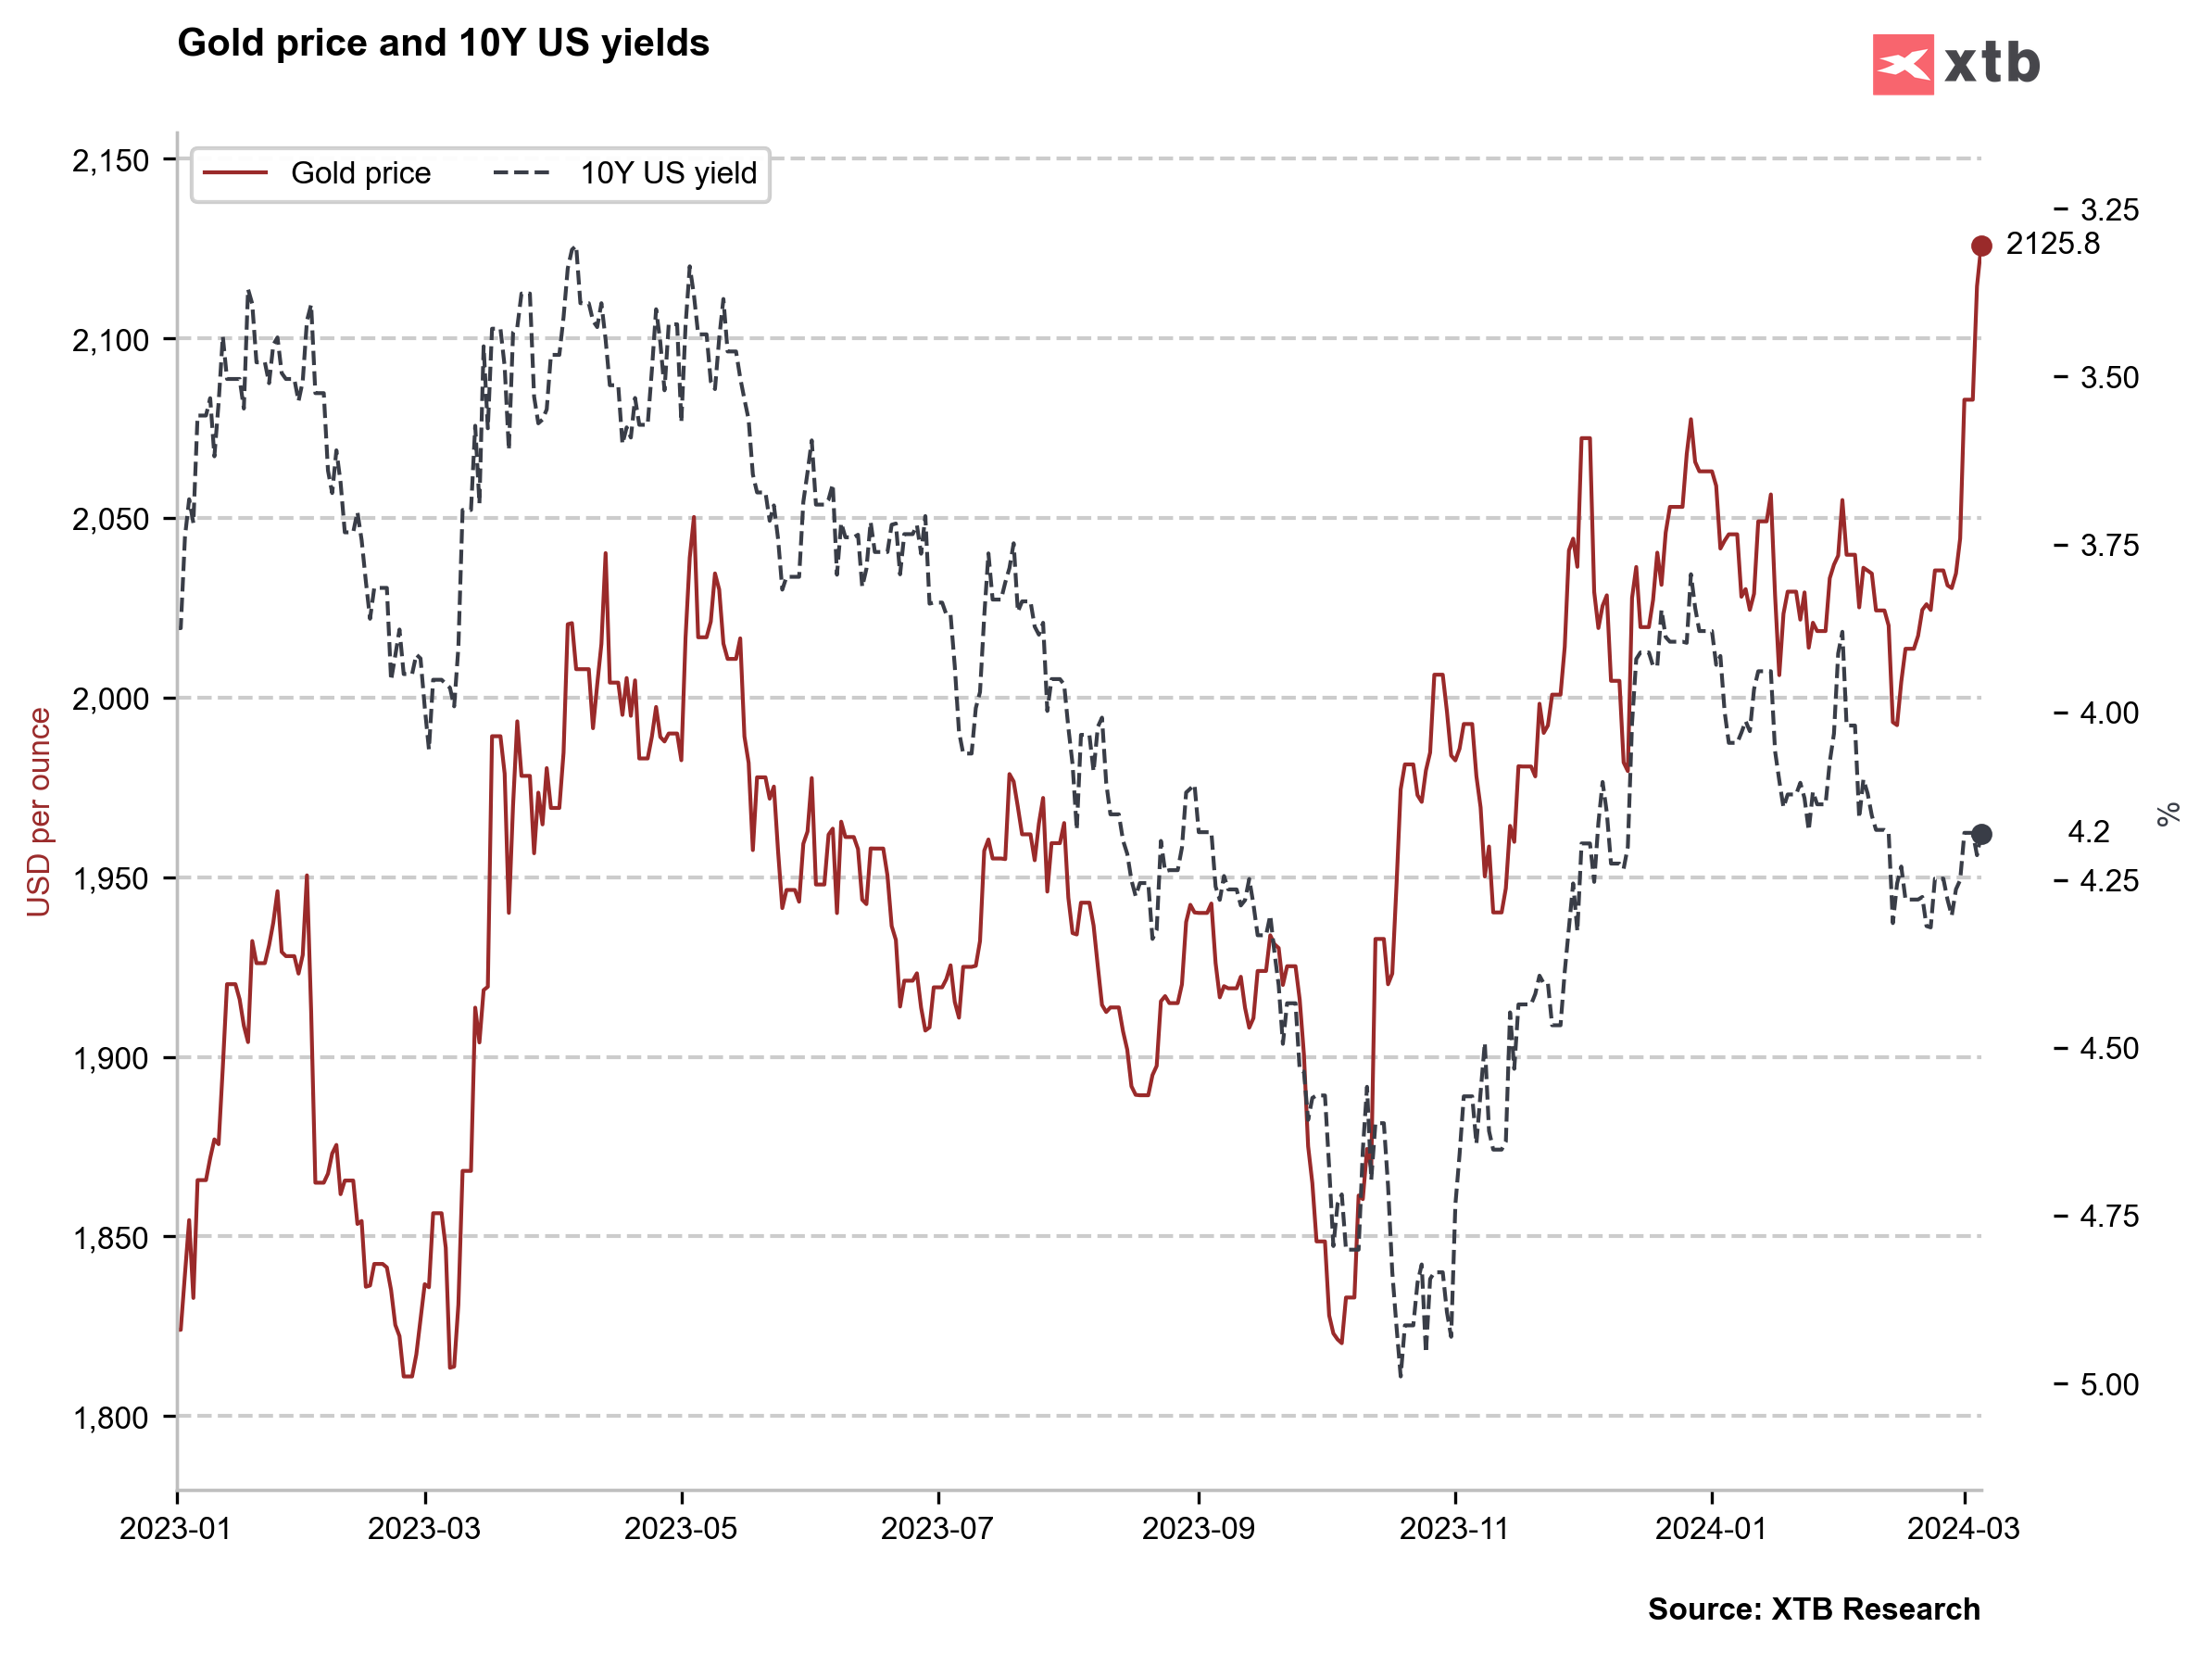
While the recent move high in gold was accompanied by a drop in yields (inverted right axis), scale of the move on the bond market did not justify surge to fresh all-time highs. Source: Bloomberg Finance LP, XTB Research
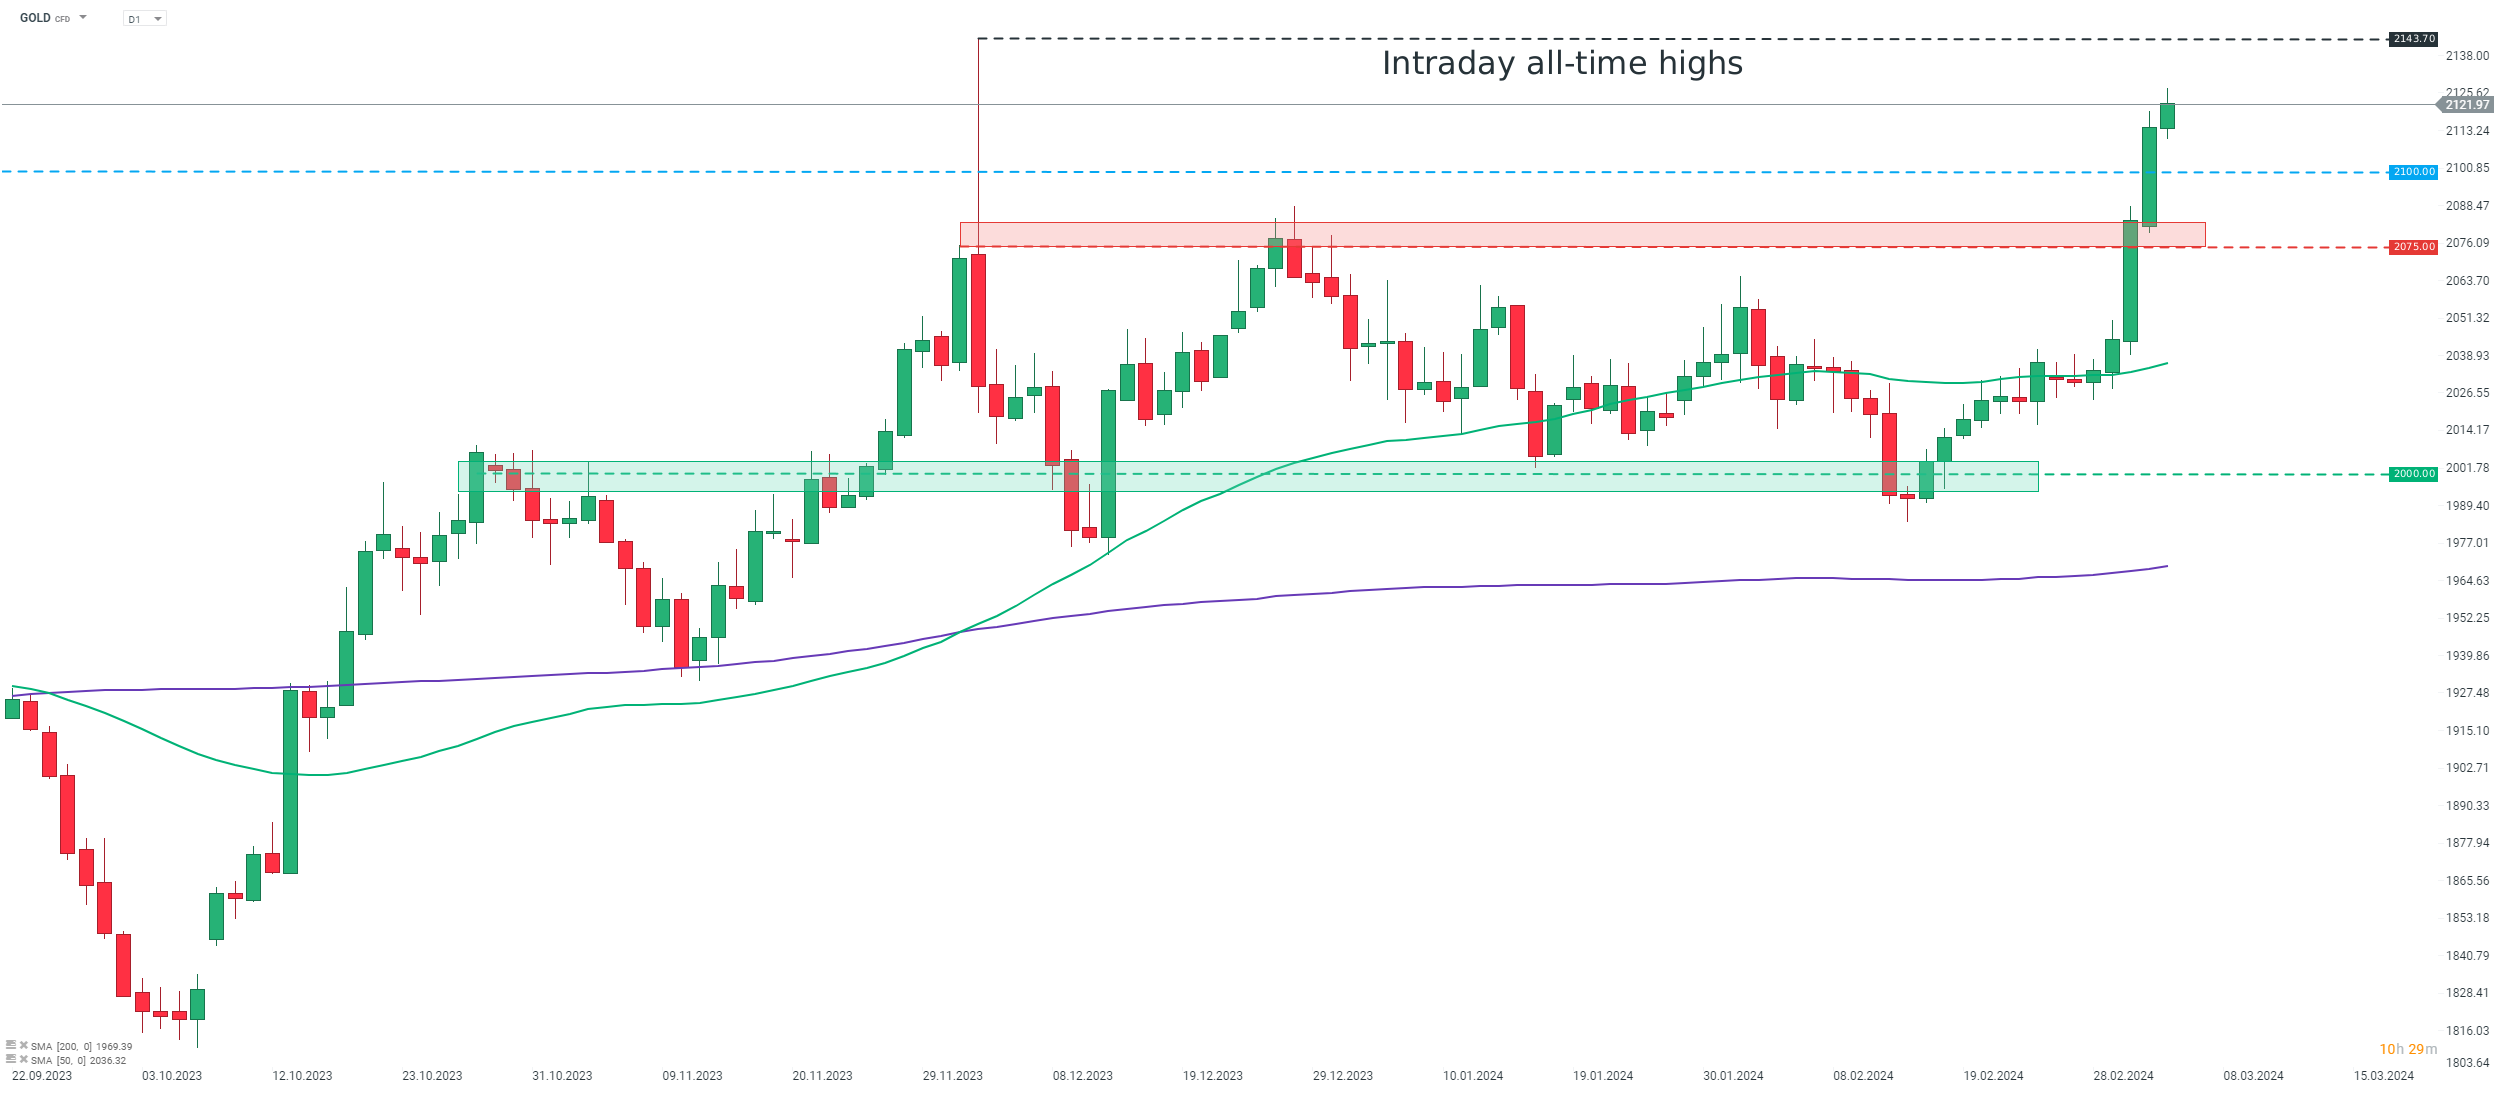
Gold closed above $2,100 per ounce yesterday for the first time in history. However, price still trades around 1% below Intraday all-time highs reached in early-December 2023. Source: xStation5
Oil
- Oil prices launched new week's trading higher, supported by weekend supply announcement from OPEC+, but failed to maintain those gains and pulled back from multi-month highs
- OPEC+ announced that it will extend 2.2 million barrels per day of voluntary output cuts through the second quarter of 2024
- China set GDP growth target for 2024 at 'around 5%', similar as it was the case last year
- The target is ambitious, but lack of any announcement on major fiscal stimulus led to a lukewarm response and questions whether the target can be achieved
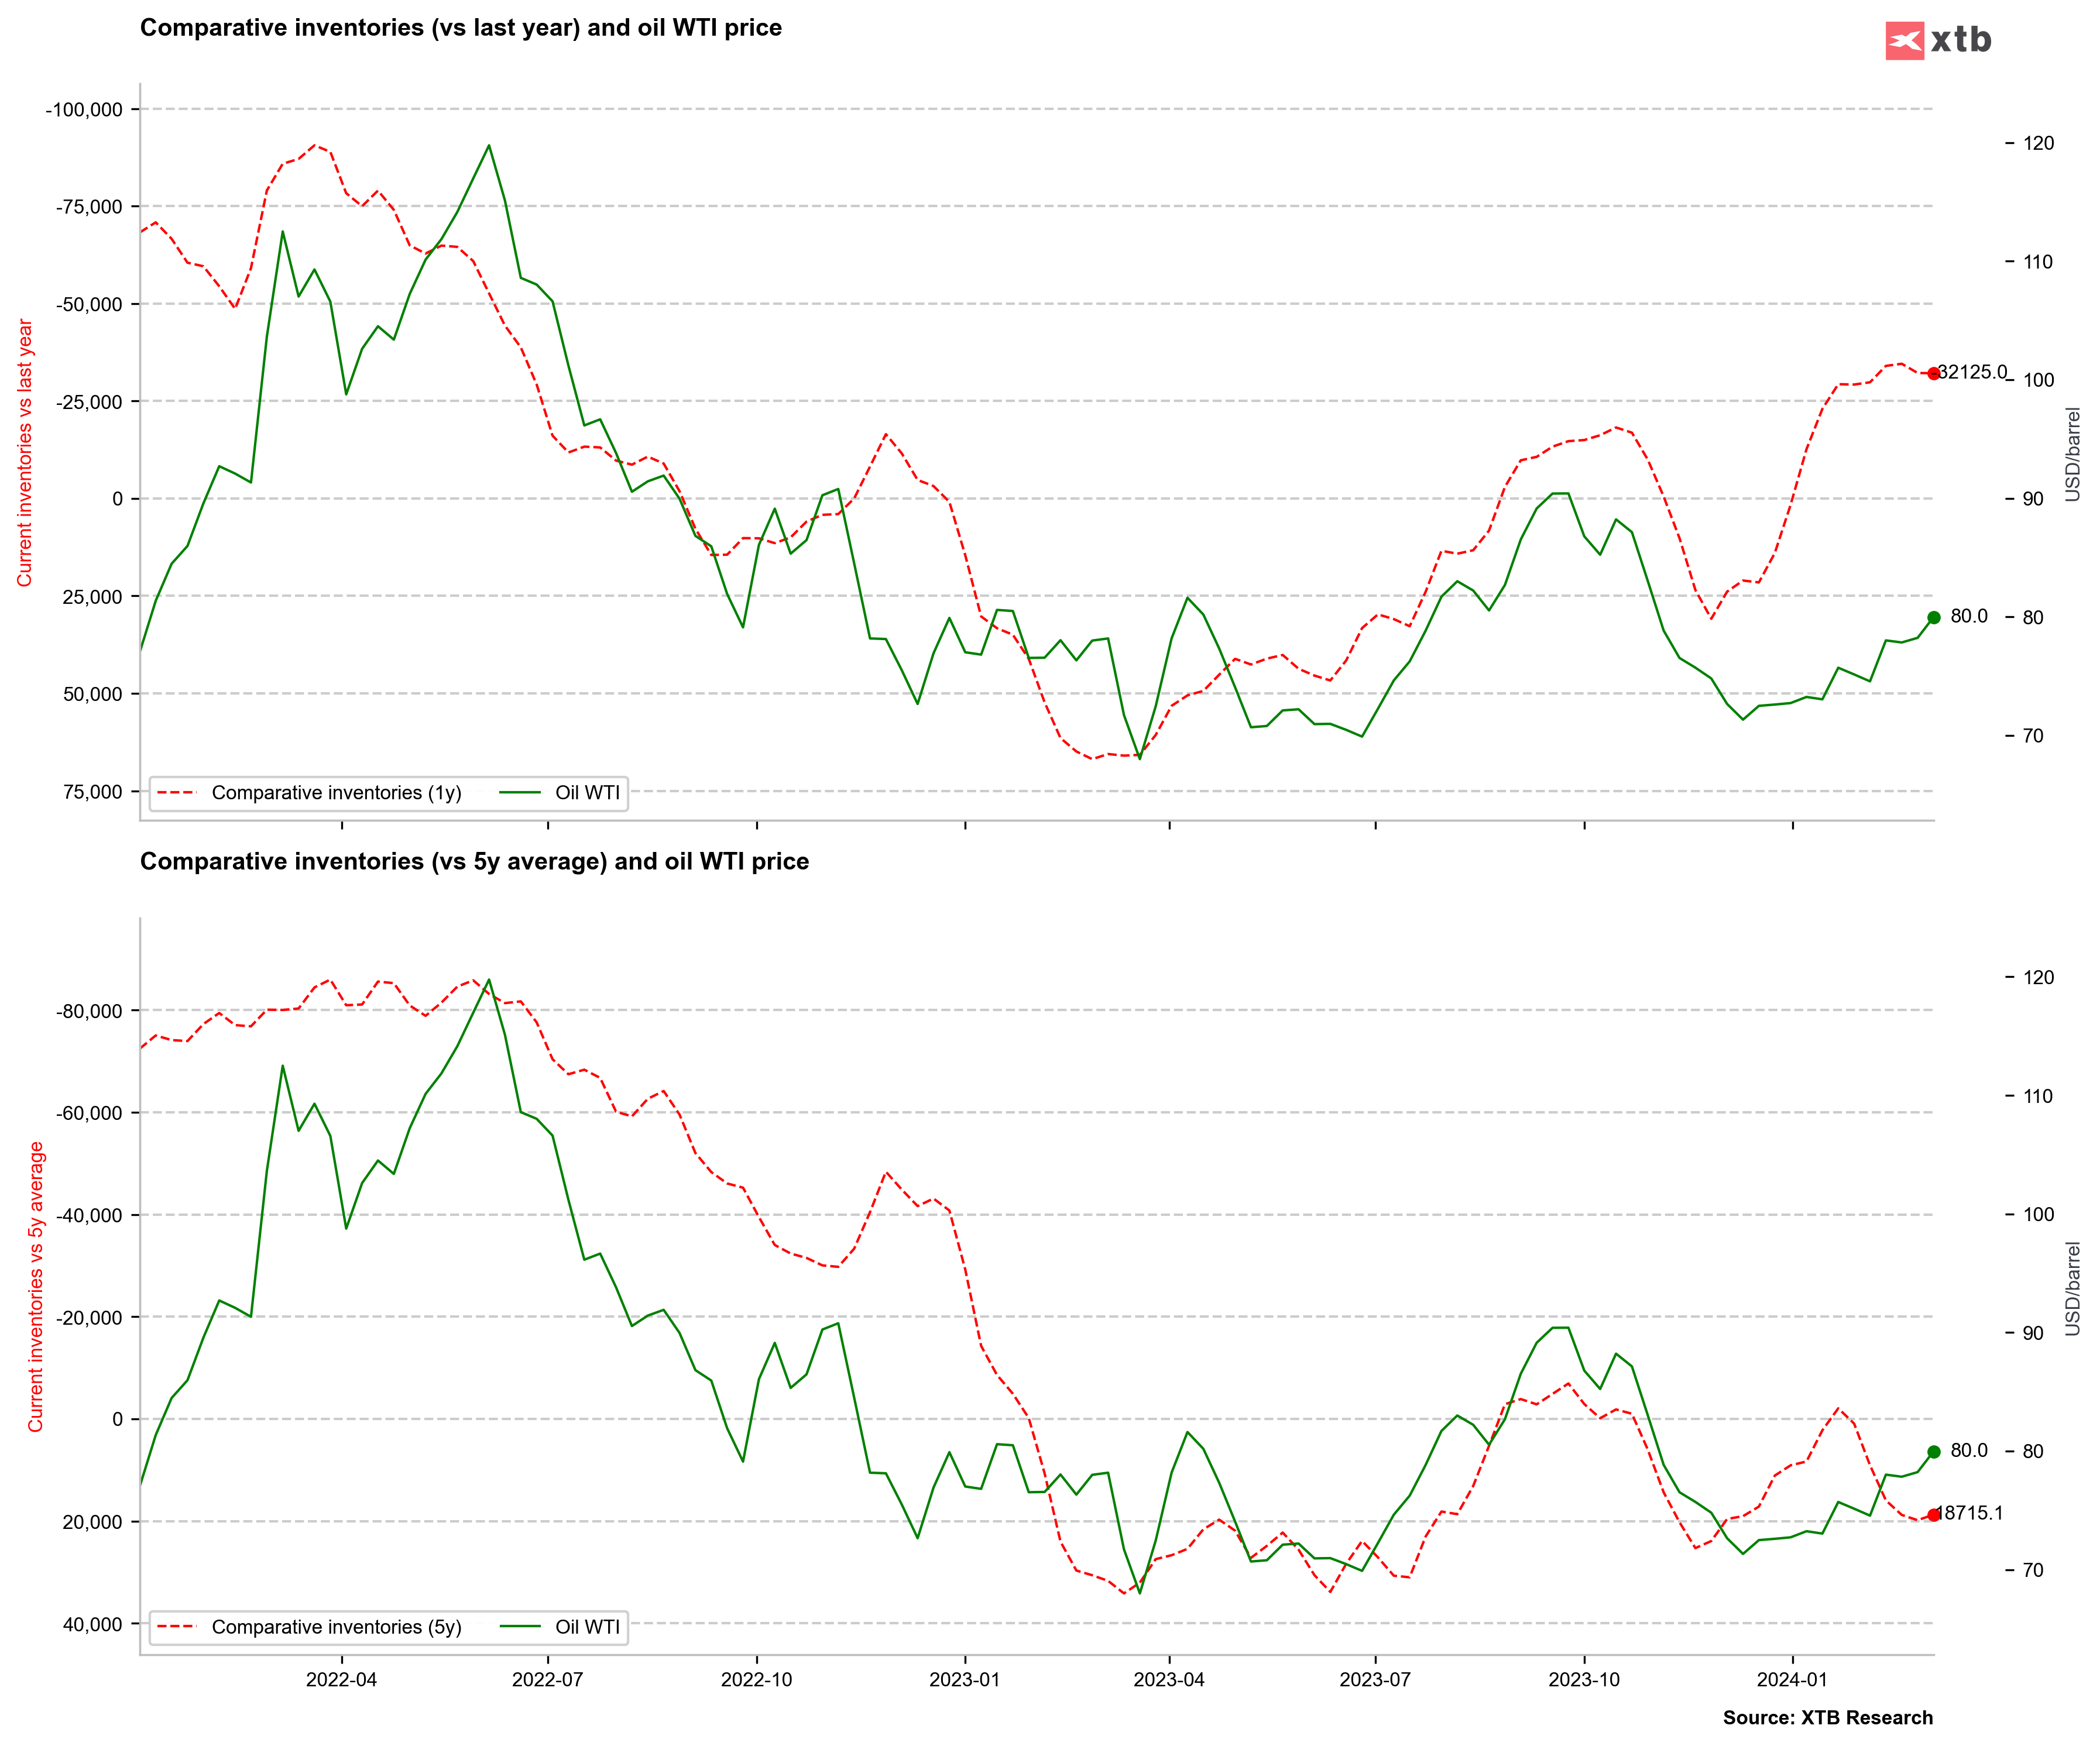
A drop in 1-year comparative oil inventories (red line, inverted axis) was not followed by a similarly strong pick-up in oil prices as traders remain concerned about condition of the global economy, especially China. Source: Bloomberg Finance LP, XTB Research
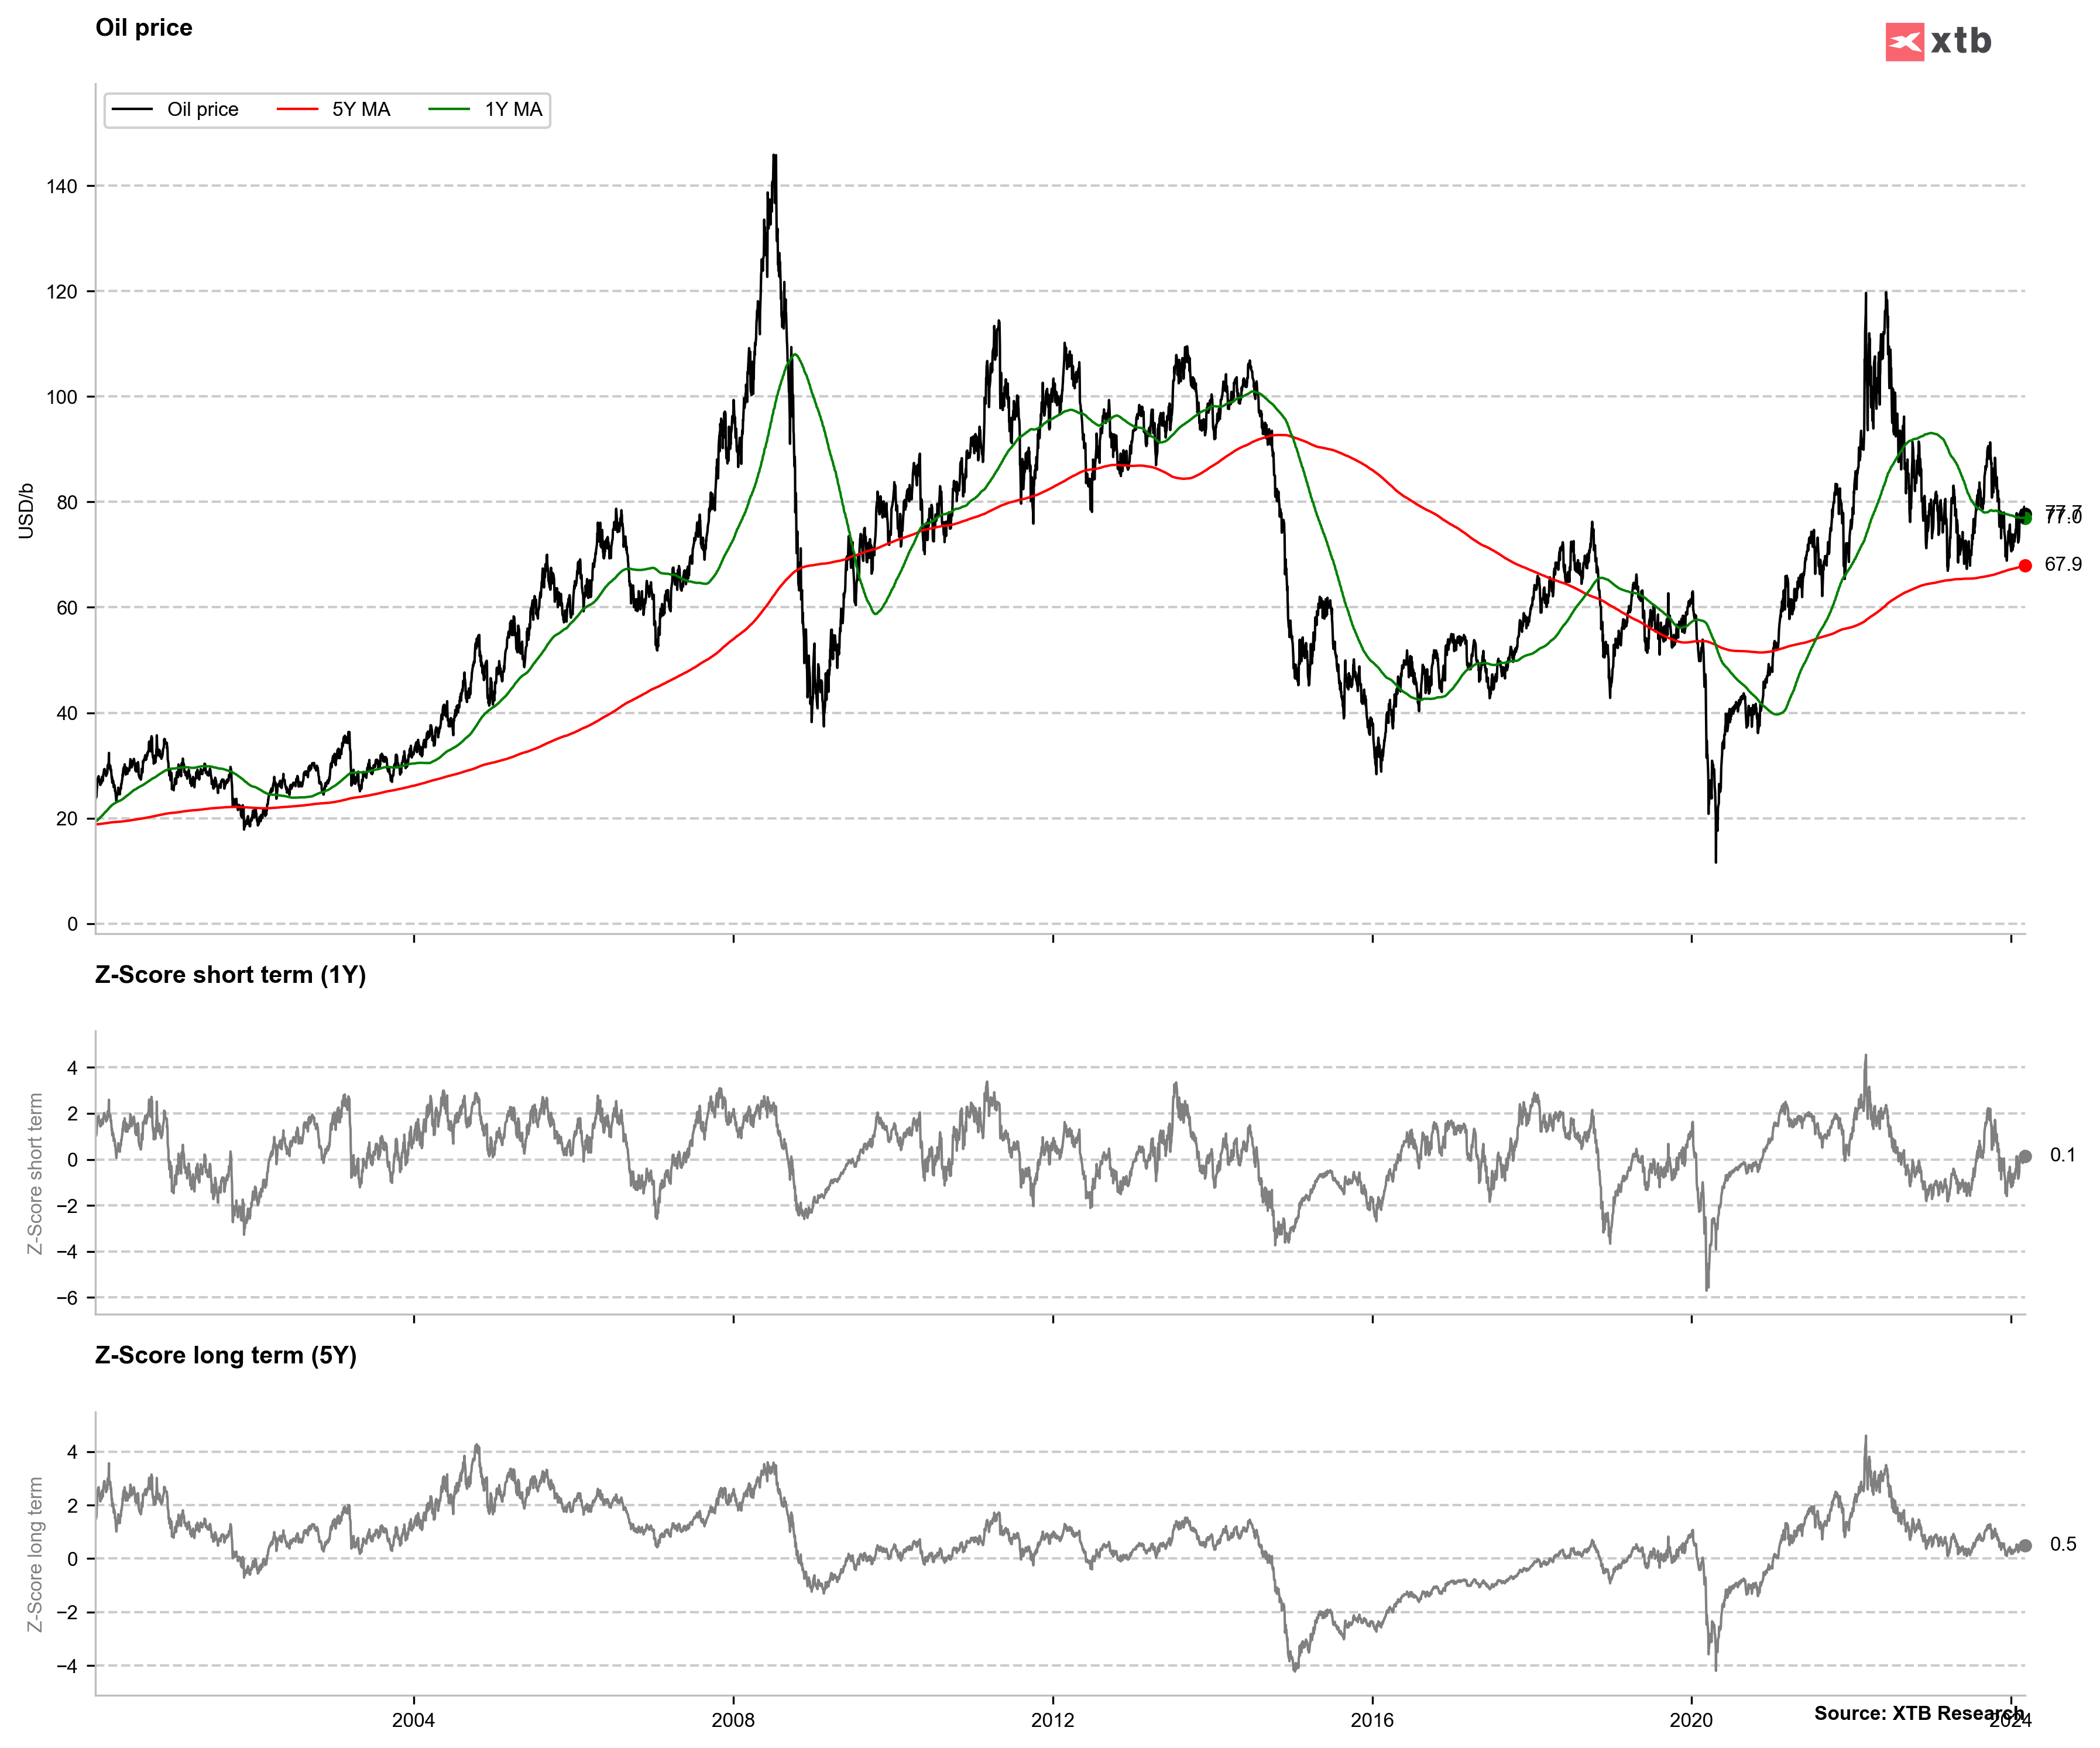
WTI is priced in-line with 1-year moving average and around a half standard deviation above 5-year average. Source: Bloomberg Finance LP, XTB Research

Brent (OIL) climbed above $83 per barrel resistance zone and briefly traded at the highest level since late-November 2023. However, bulls failed to hold onto those gains and priced pulled back below the $83 area. Lukewarm economic target announcement from China today is adding to pressure, with OIL testing 200-session moving average (purple line). Source: xStation5
Natural Gas
- US natural gas prices launched new week's trading with a jump
- Jump came in spite of new weather forecasts that pointed to above-average temperatures over a larger part of the US mainland than pre-weekend forecasts did
- Moreover, below-average temperatures are now seen only in the north-western part of US mainland, rather than across the whole West Coast
- EQT, the largest natural gas producer in US Appalachian Basin, said that it will cut March production by about 1 billion cubic feet per day amid warm winter weather and elevated storage levels
- European Union agreed to extend a voluntary 15% gas demand cut goal through March 31, 2025, in an attempt to make the bloc more resilient to future supply shocks
- European natural gas inventories remain 62% full, the most they have been at this time of the year over the past 5 years
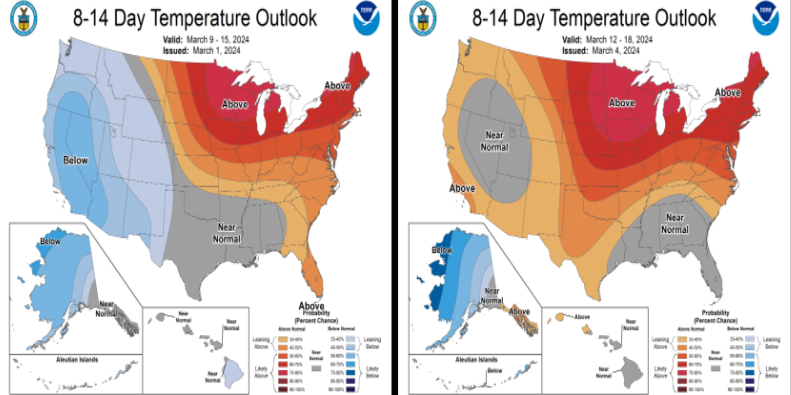
New weather forecast released this week suggest above-average temperatures almost all across the US mainland, including in key heating regions. Forecasts released as recently as on Friday suggested below-average temperatures across majority of the West Coast. Source: Bloomberg Finance LP
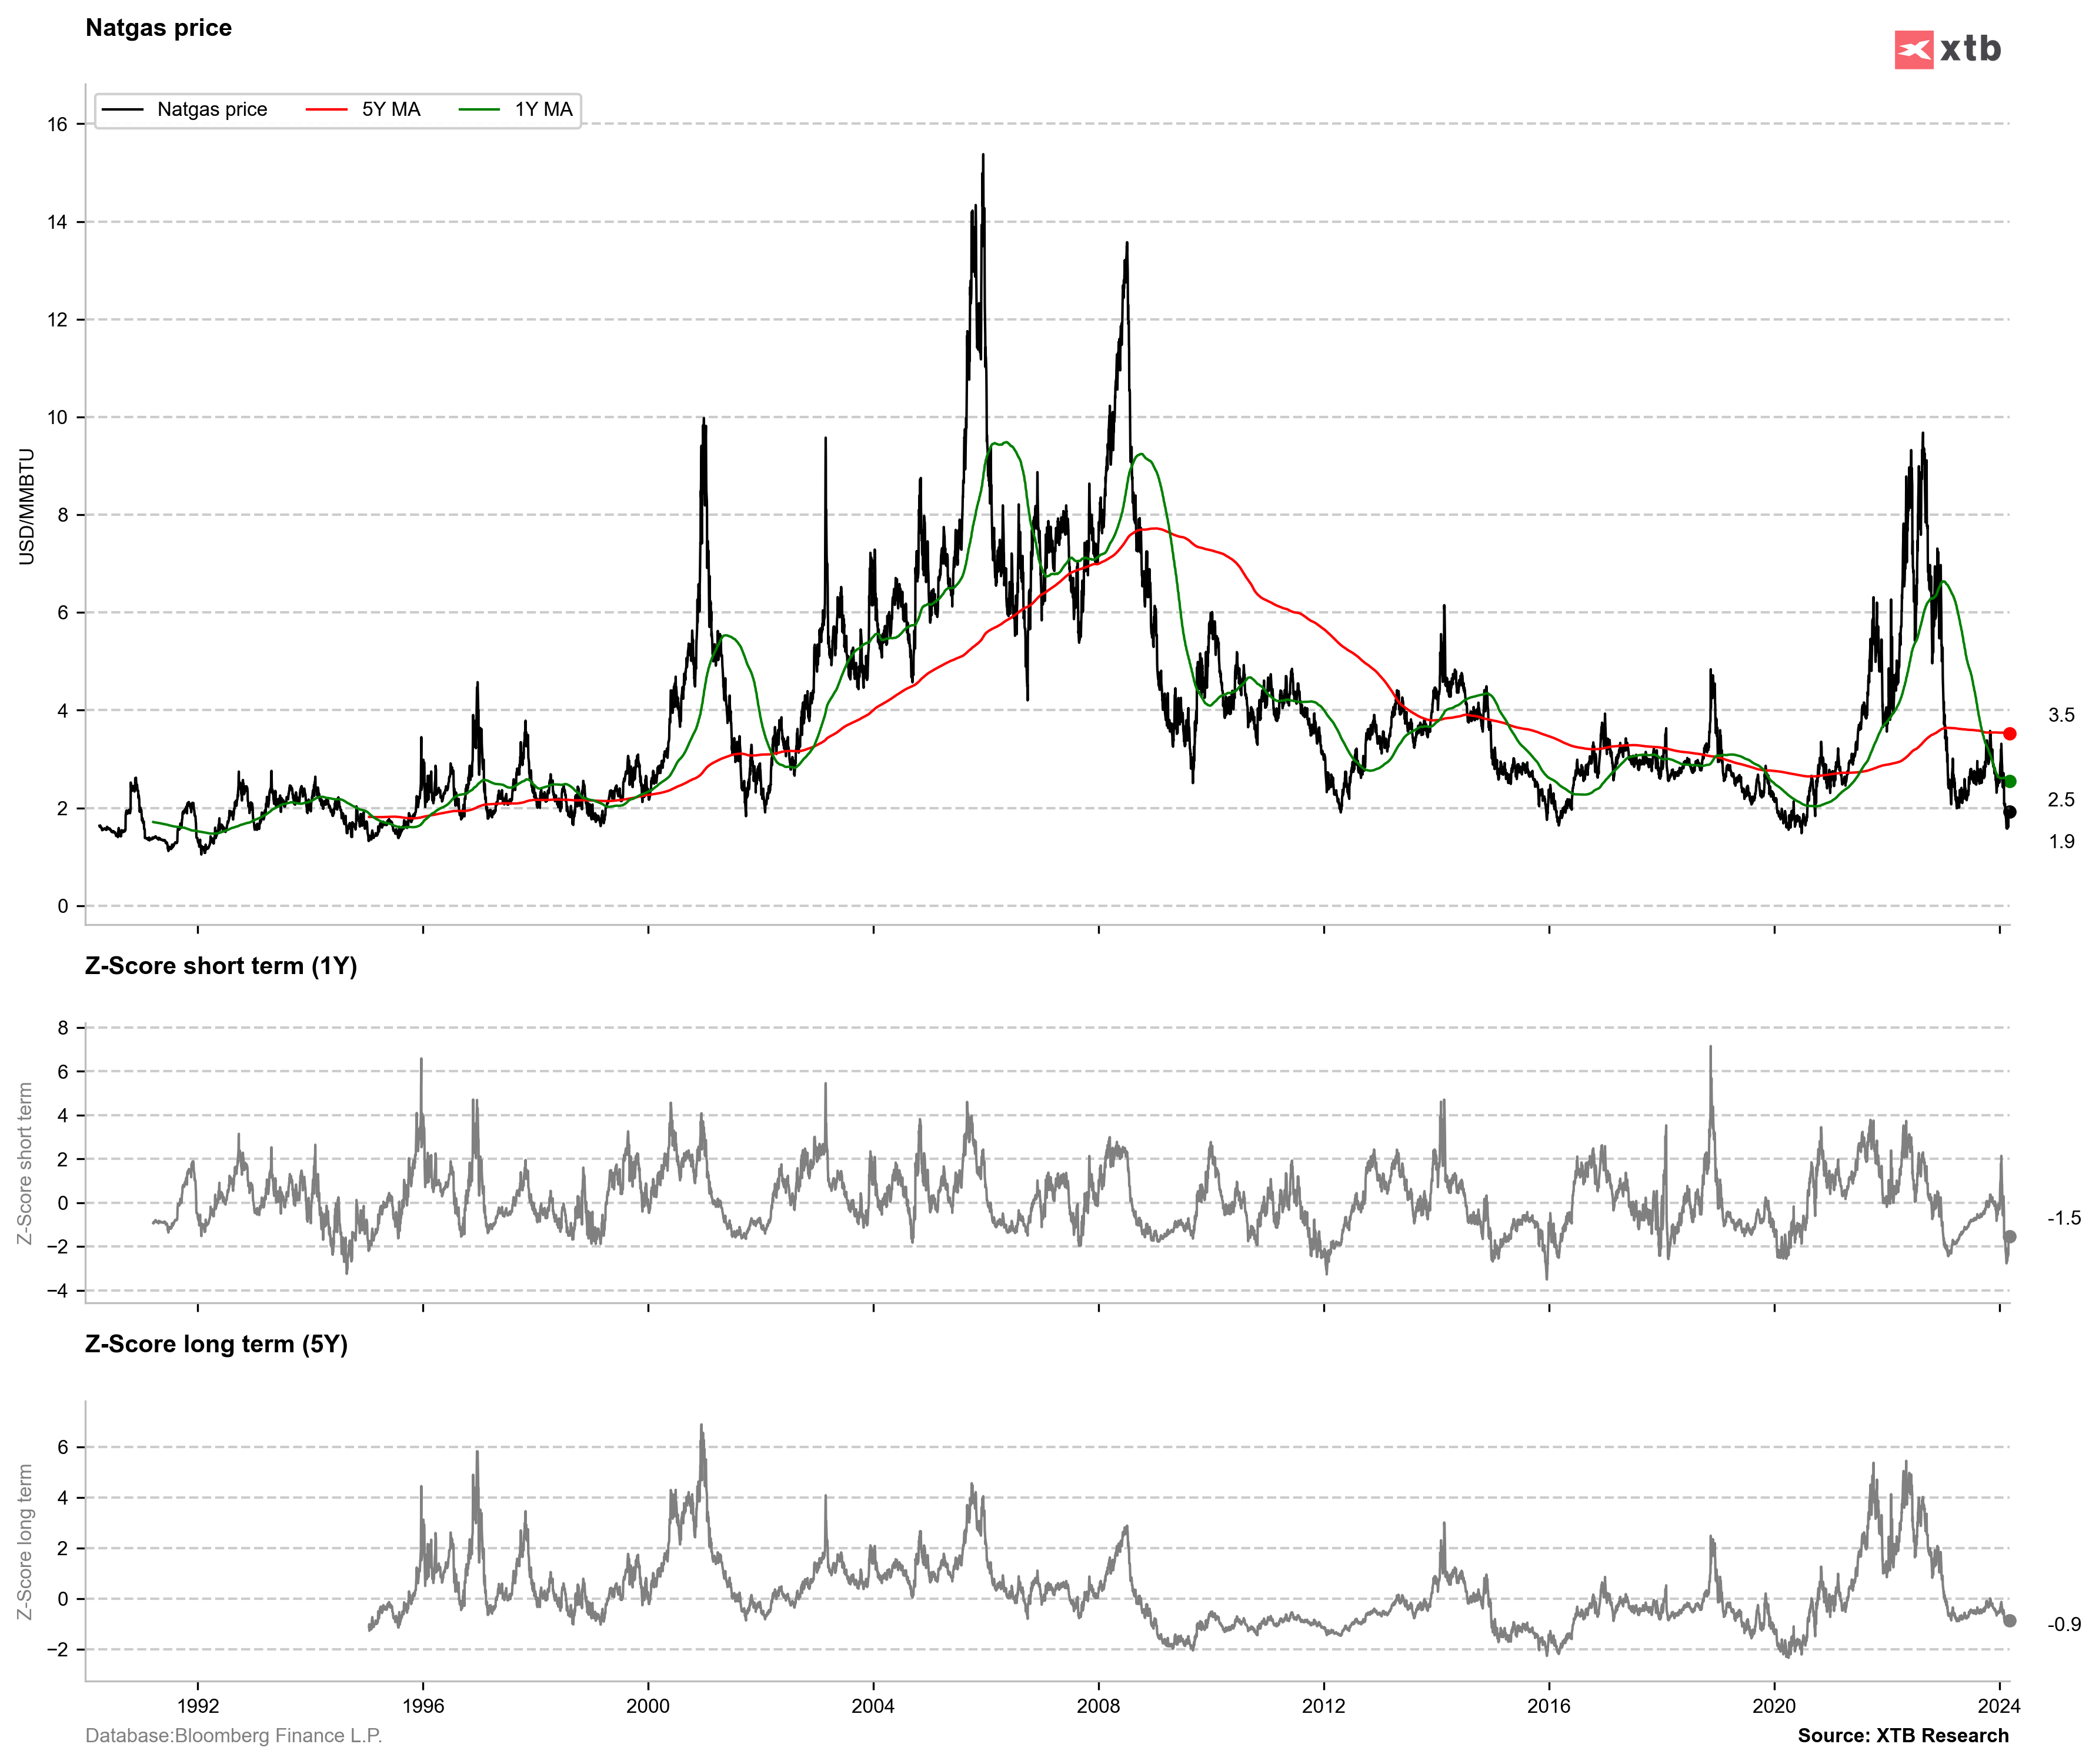
US natural gas prices (NATGAS) are recovering after dropping by more than 2 standard deviations below 1-year mean. Source: Bloomberg Finance LP, XTB Research
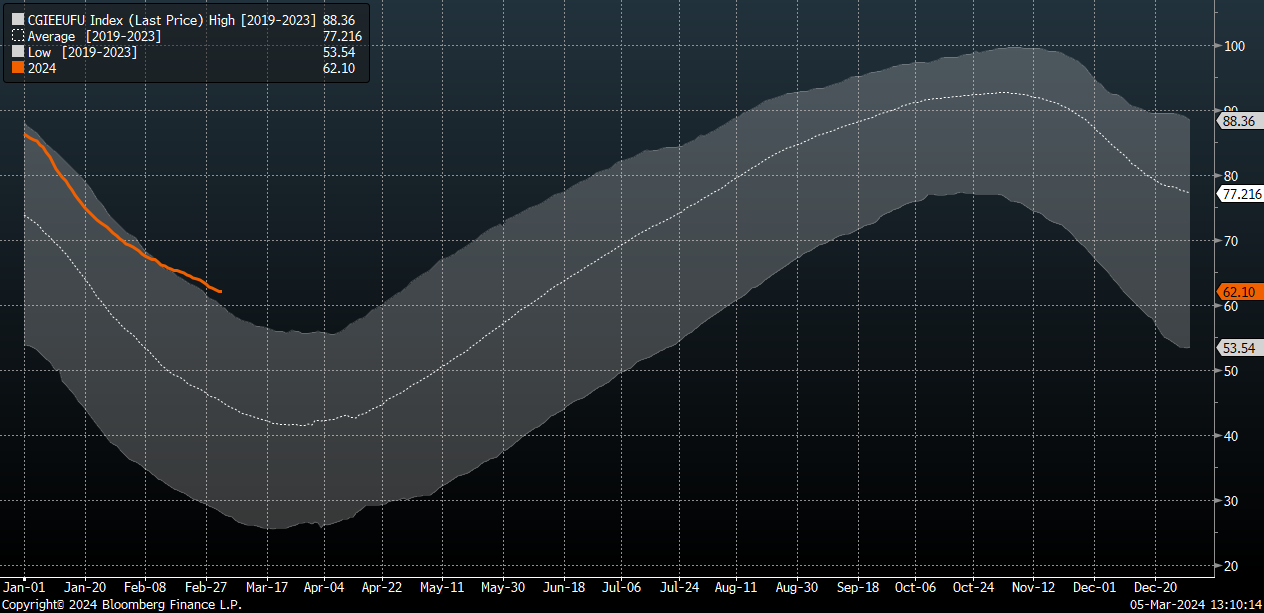
European natural gas inventories are around 62% full, while 5-year average for current period of the year is around 46%. Source: Bloomberg Finance LP
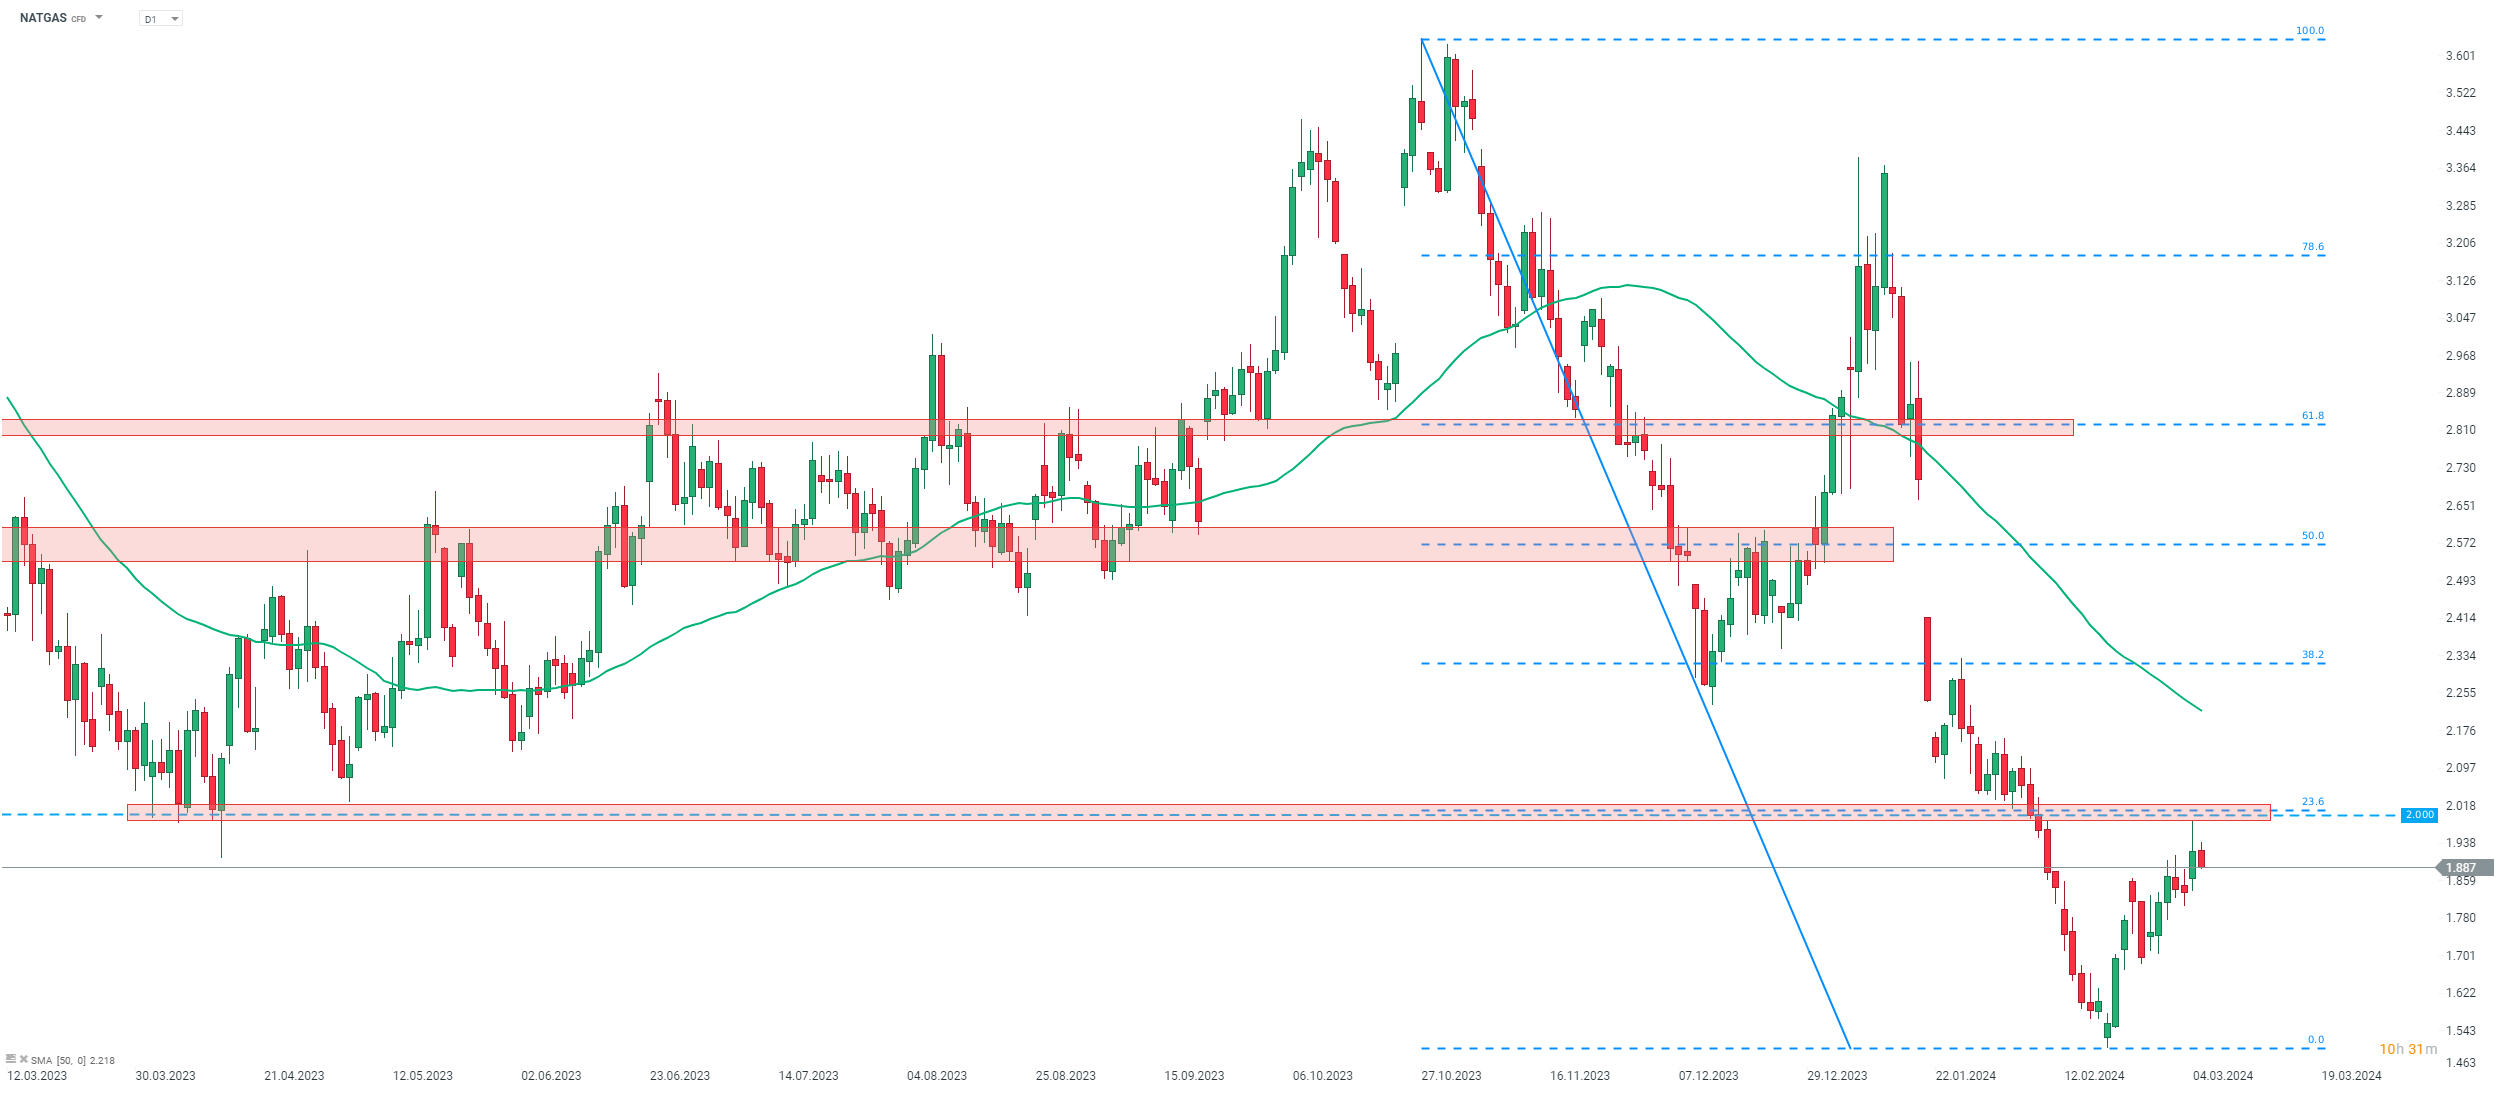
US natural gas prices (NATGAS) trade around 25% above mid-February lows. Price climbed on EQT announcement yesterday and tested the $2.00 per MMBTu area. However, bulls did not manage to break above and price pulled back below $1.90 mark today. Source: xStation5
Sugar
- Sugar prices plunged at the end of the previous week and dropped to the lowest level in almost 2 months
- Pullback was driven by reports hinting at an ample supply of commodity
- ICE reported that traders will deliver 1.3 million metric tons to settle expiration of March 2024 contract, marking an over 120% increase compared to settlement of March 2023 contract
- According to ISMA data, India's sugar output in the October 2023 - February 2024 period reached 25.5 million tons and was lower than 25.85 million reported in the same period a year earlier
- According to BP Bunge, sugar supply in 2024-2025 is likely to by around 1.6 million tons smaller than demand
- Ongoing pullback is in-line with seasonality. A local low should be reached in the second half of March, followed by an around two-month long price recovery
 SUGAR plunged amid reports hinting at an ample supply of the commodity and a surplus in 2024-2025 period. Price dropped to the lowest level since the turn of the year. Seasonality suggests that declines are not over yet, putting 20.30 support zone at risk. Source: xStation5
Daily Summary – Wall Street Rally Driven by Powell’s Promises
Cocoa Prices Stabilize Ahead of Processing Data: Has the Negative News Been Priced In?
GOLD surges 1.4% 📈
Daily Summary: Powell pulls markets back up! 📈 EURUSD higher


