



Oil:
- Crude oil, after declines at the beginning of last week, returned to strong gains in the face of huge uncertainty regarding the future of the Strait of Hormuz.
- Iran indicates that it is reaching an agreement with Oman regarding the restoration of traffic in the Strait of Hormuz, but at the same time announces the maintenance of its blockade until 2029 – which is until the end of Donald Trump's presidency or the moment of the return of frozen funds, the lifting of sanctions, and the withdrawal of the American military from the Middle East.
- During the second session this week, crude oil rose by over 2%. Brent oil is testing the area of 90 USD per barrel, while WTI oil is exceeding the level of 84 USD. On the other hand, Pakistan informs that the United States is supposed to be conducting talks with Iran regarding an agreement, which led to the reversal of the entire daily gain in the market.
- On a weekly scale, oil gained as much as 12%, and compared to last week, the increase was almost 8%. Currently, the dynamics of moves have been limited. The price remains above the 1-year, 2-year, and 5-year averages, with the largest overvaluation visible relative to the 2-year average.
- Although the Strait of Hormuz remains officially closed, the transport of the commodity through this strait continues. Nevertheless, sources suggest a drop in volume from over 4 million bbl/d last week to approx. 3 million bbl/d currently. Before the outbreak of the conflict, approx. 20 million bbl/d was transported.
- Current comments should not generate further drastic increases. Freezing the conflict at the current stage could keep prices in a wide range of 70–90 USD per barrel. Only a potential US attack on Iran's energy infrastructure or an intensification of Iran's actions against targets in the region could lead to a permanent breakout above the 100 USD level.
Crude oil and crack spread
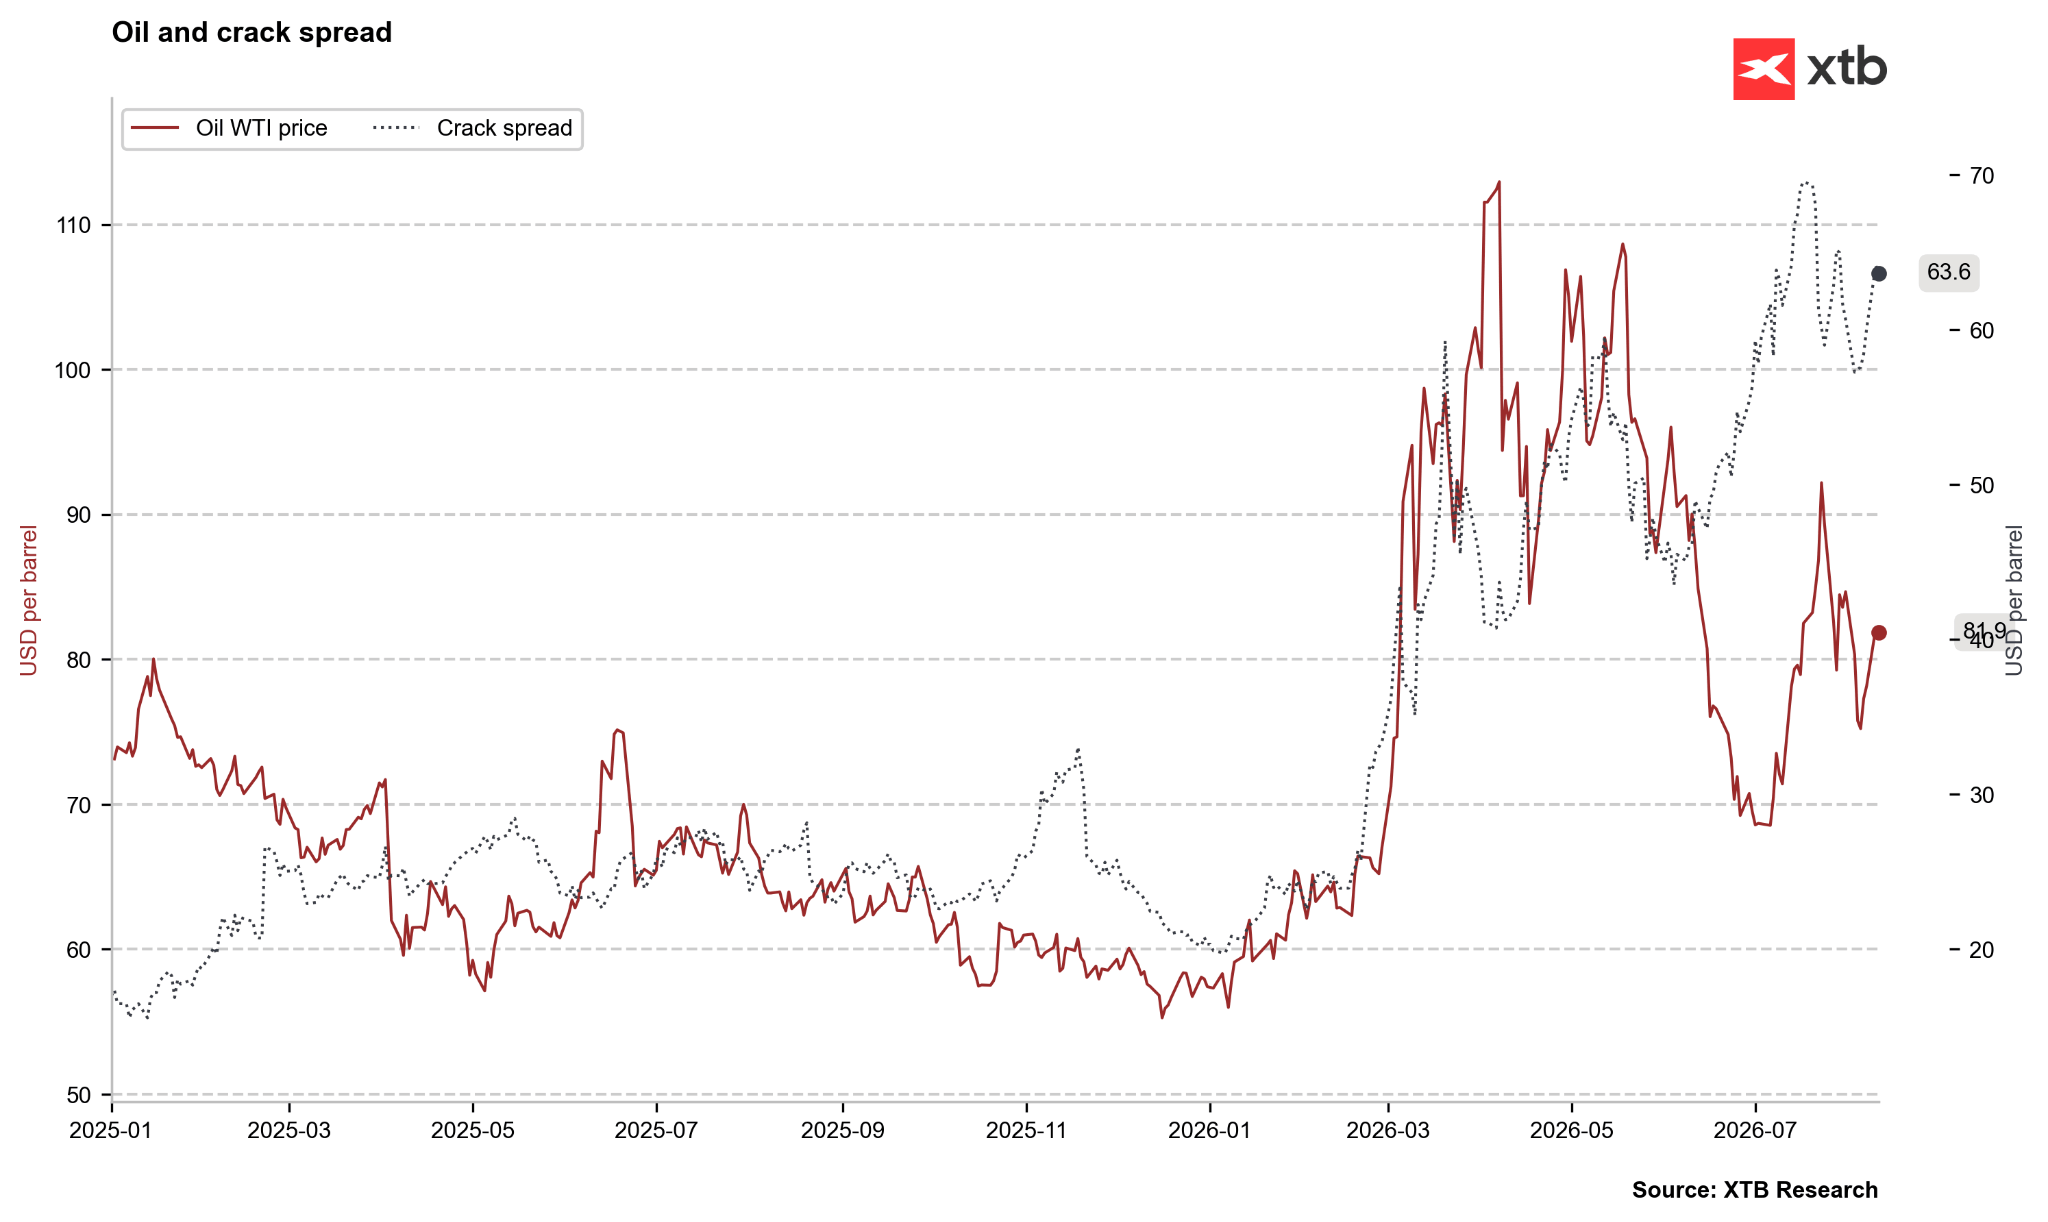
Volatility in the crude oil market is growing, and the crack spread remains at a high level, which highlights the tense situation in the fuel market. Currently, the challenge is not access to the oil itself, but the supply of petroleum products. Source: Bloomberg Finance LP, XTB
Oil benchmarks and curve spreads
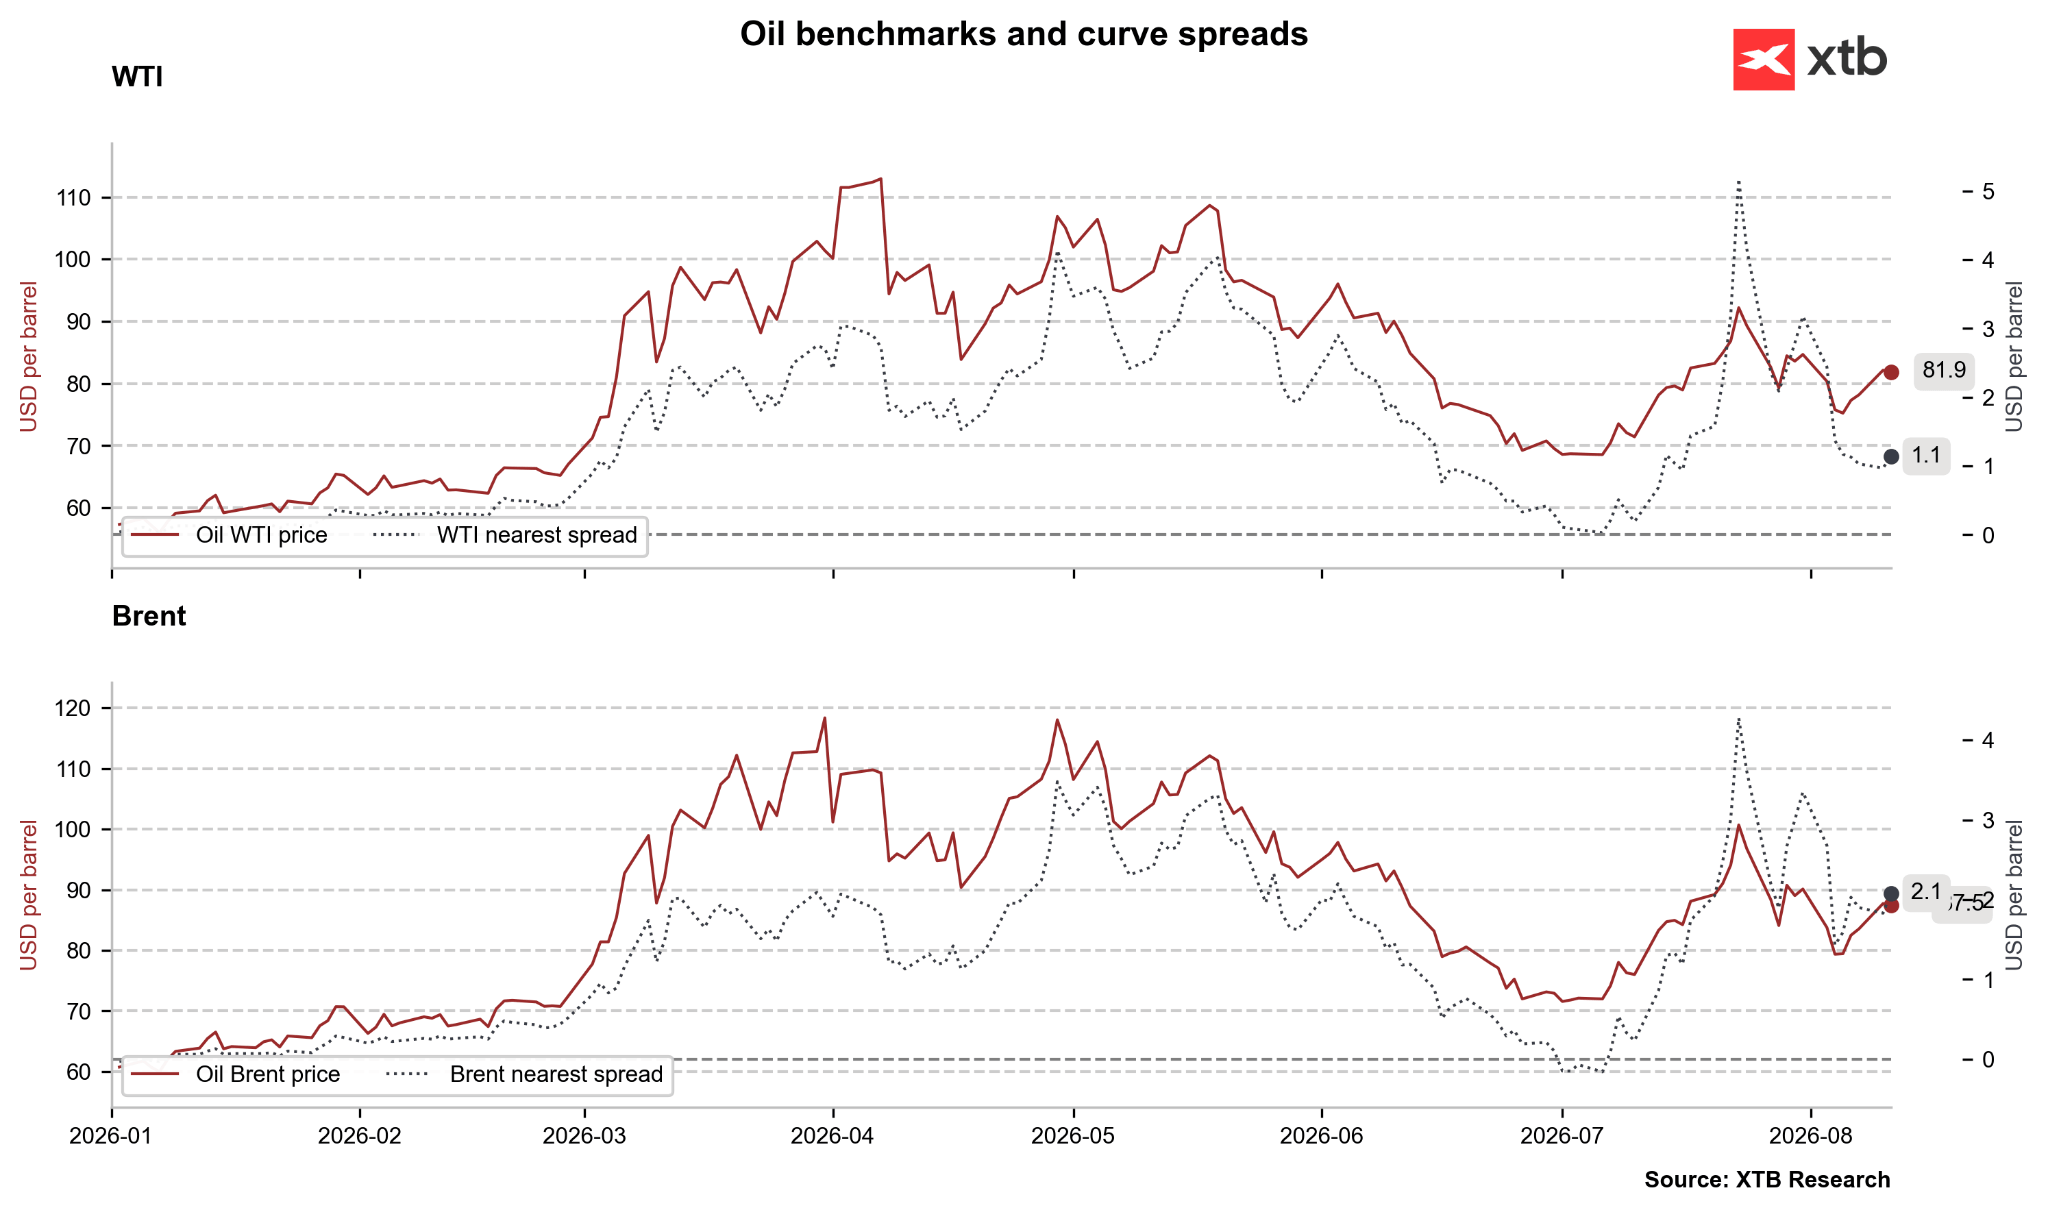
The nearest calendar spreads remain at limited levels and may even indicate a slight overvaluation of prices. It is worth noting, however, that the oil market remains in clear backwardation. Source: Bloomberg Finance LP, XTB
Technical analysis of crude oil
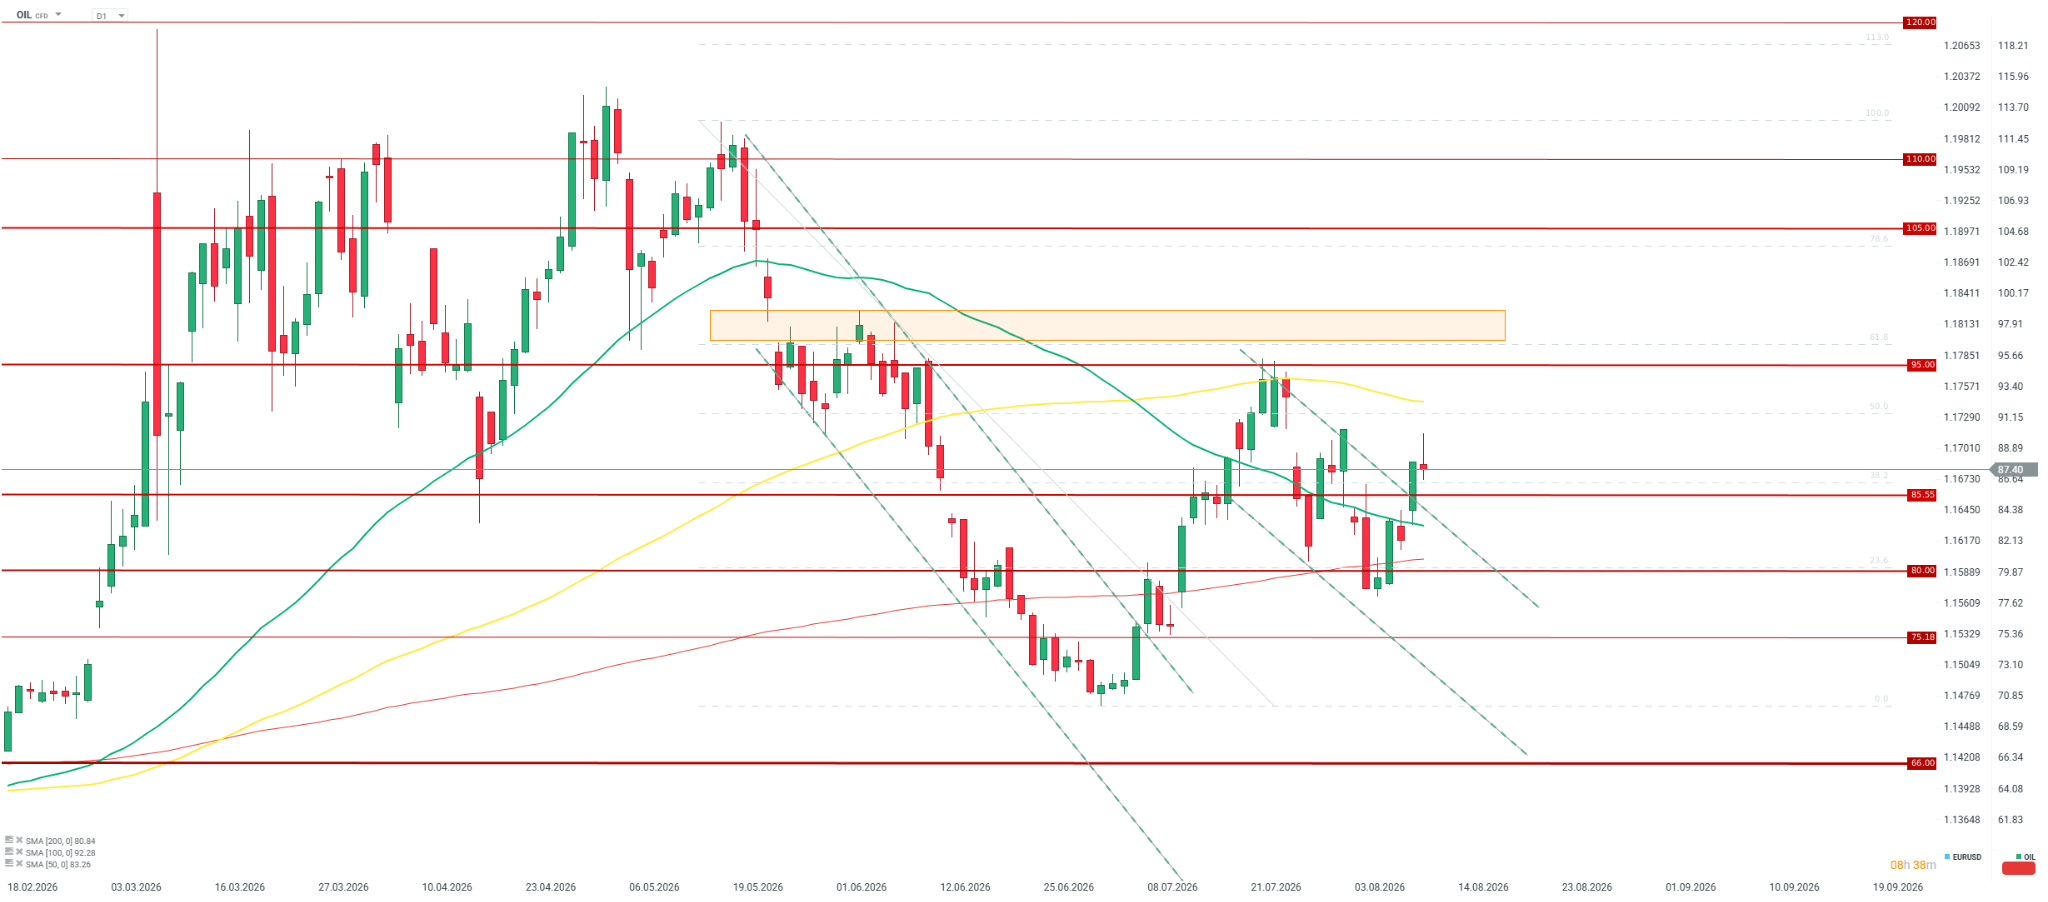
Crude oil clearly rebounded at the beginning of this week, breaking out of a downward trend, but if the price closes with a clear candle wick, pressure will arise to return below 85 USD per barrel. In the case of a green body at the end of the session, the price may try to test the 100-period average above 92 USD per barrel. Source: xStation5
Gold:
- Gold tested 4400 USD per ounce for the first time since the beginning of June. Since the beginning of this month, this is an upward movement of approx. 8%
- The main upward motif in the gold market is the change in sentiment regarding the Federal Reserve. Along with Warsh's nondescript comment at the last Fed meeting and weaker labor market data, the probability of a hike in September falls to a level of approx. 35%
- Gold is breaking through the 50-period average for the first time since mid-May and is testing the 100-period average.
- It is worth noting that gold in the short term is weakly or sometimes even negatively correlated with inflation, due to rising expectations for interest rate hikes. In the longer term, gold is positively correlated with gold.
- Concerns that the Fed will again miss the inflation target due to the lack of a concrete plan are causing a stronger increase in yields at the long end of the yield curve (a significant move in 30-year yields).
- Medium-term yields (10-year) remain at an elevated level, which may potentially indicate a slight overvaluation of gold at this moment.
- On the other hand, high yields may also show concerns regarding the fiscal situation in the United States, which may also be shown by the behavior of central banks.
- Central banks remain active in terms of gold purchases in the market, significantly increasing purchases in the second quarter of this year. At the same time, total demand in Q2 turned out to be quite weak.
- We are observing clear signs of improved demand: ETF funds have resumed gold purchases, which may be related to the better condition of the US stock market (gold became an asset with higher volatility at the turn of 2025/2026). At the same time, increased buyer activity is visible in the futures market in China.
Gold positioning on COMEX and in Shanghai
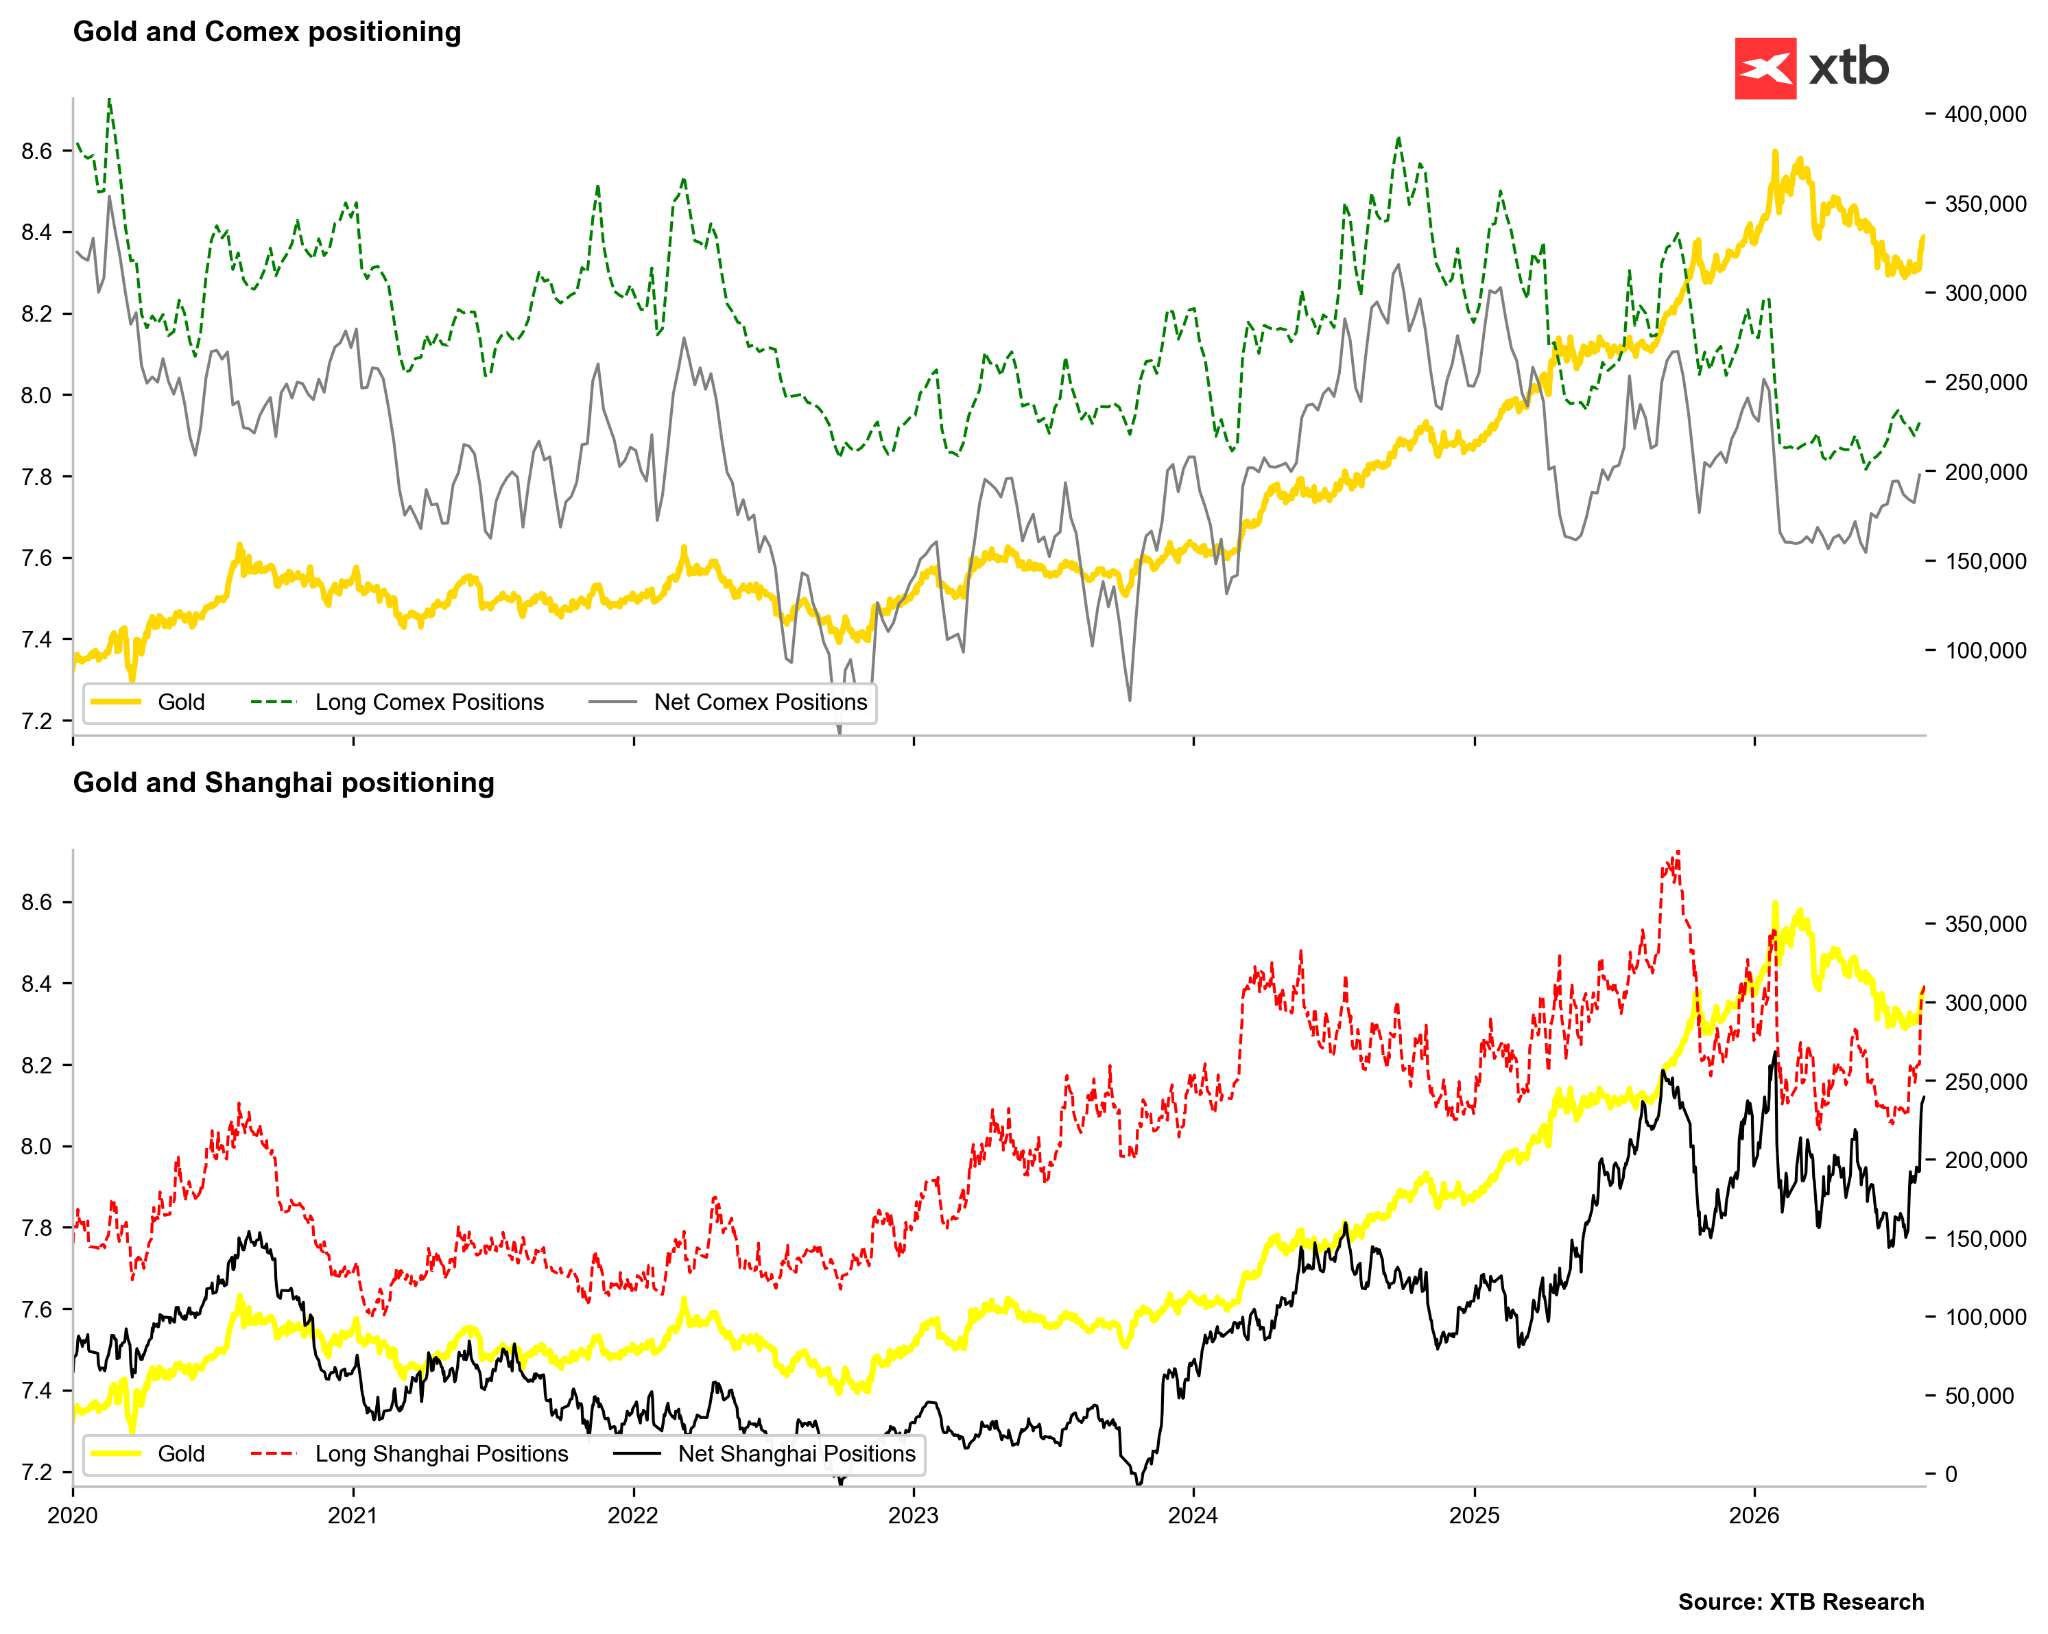
Although we still do not observe activity from investors on COMEX, in the case of the market in Shanghai, a powerful rebound in long positions is visible, to the highest levels since January. Source: Bloomberg Finance LP, XTB
Gold price and ETF holdings
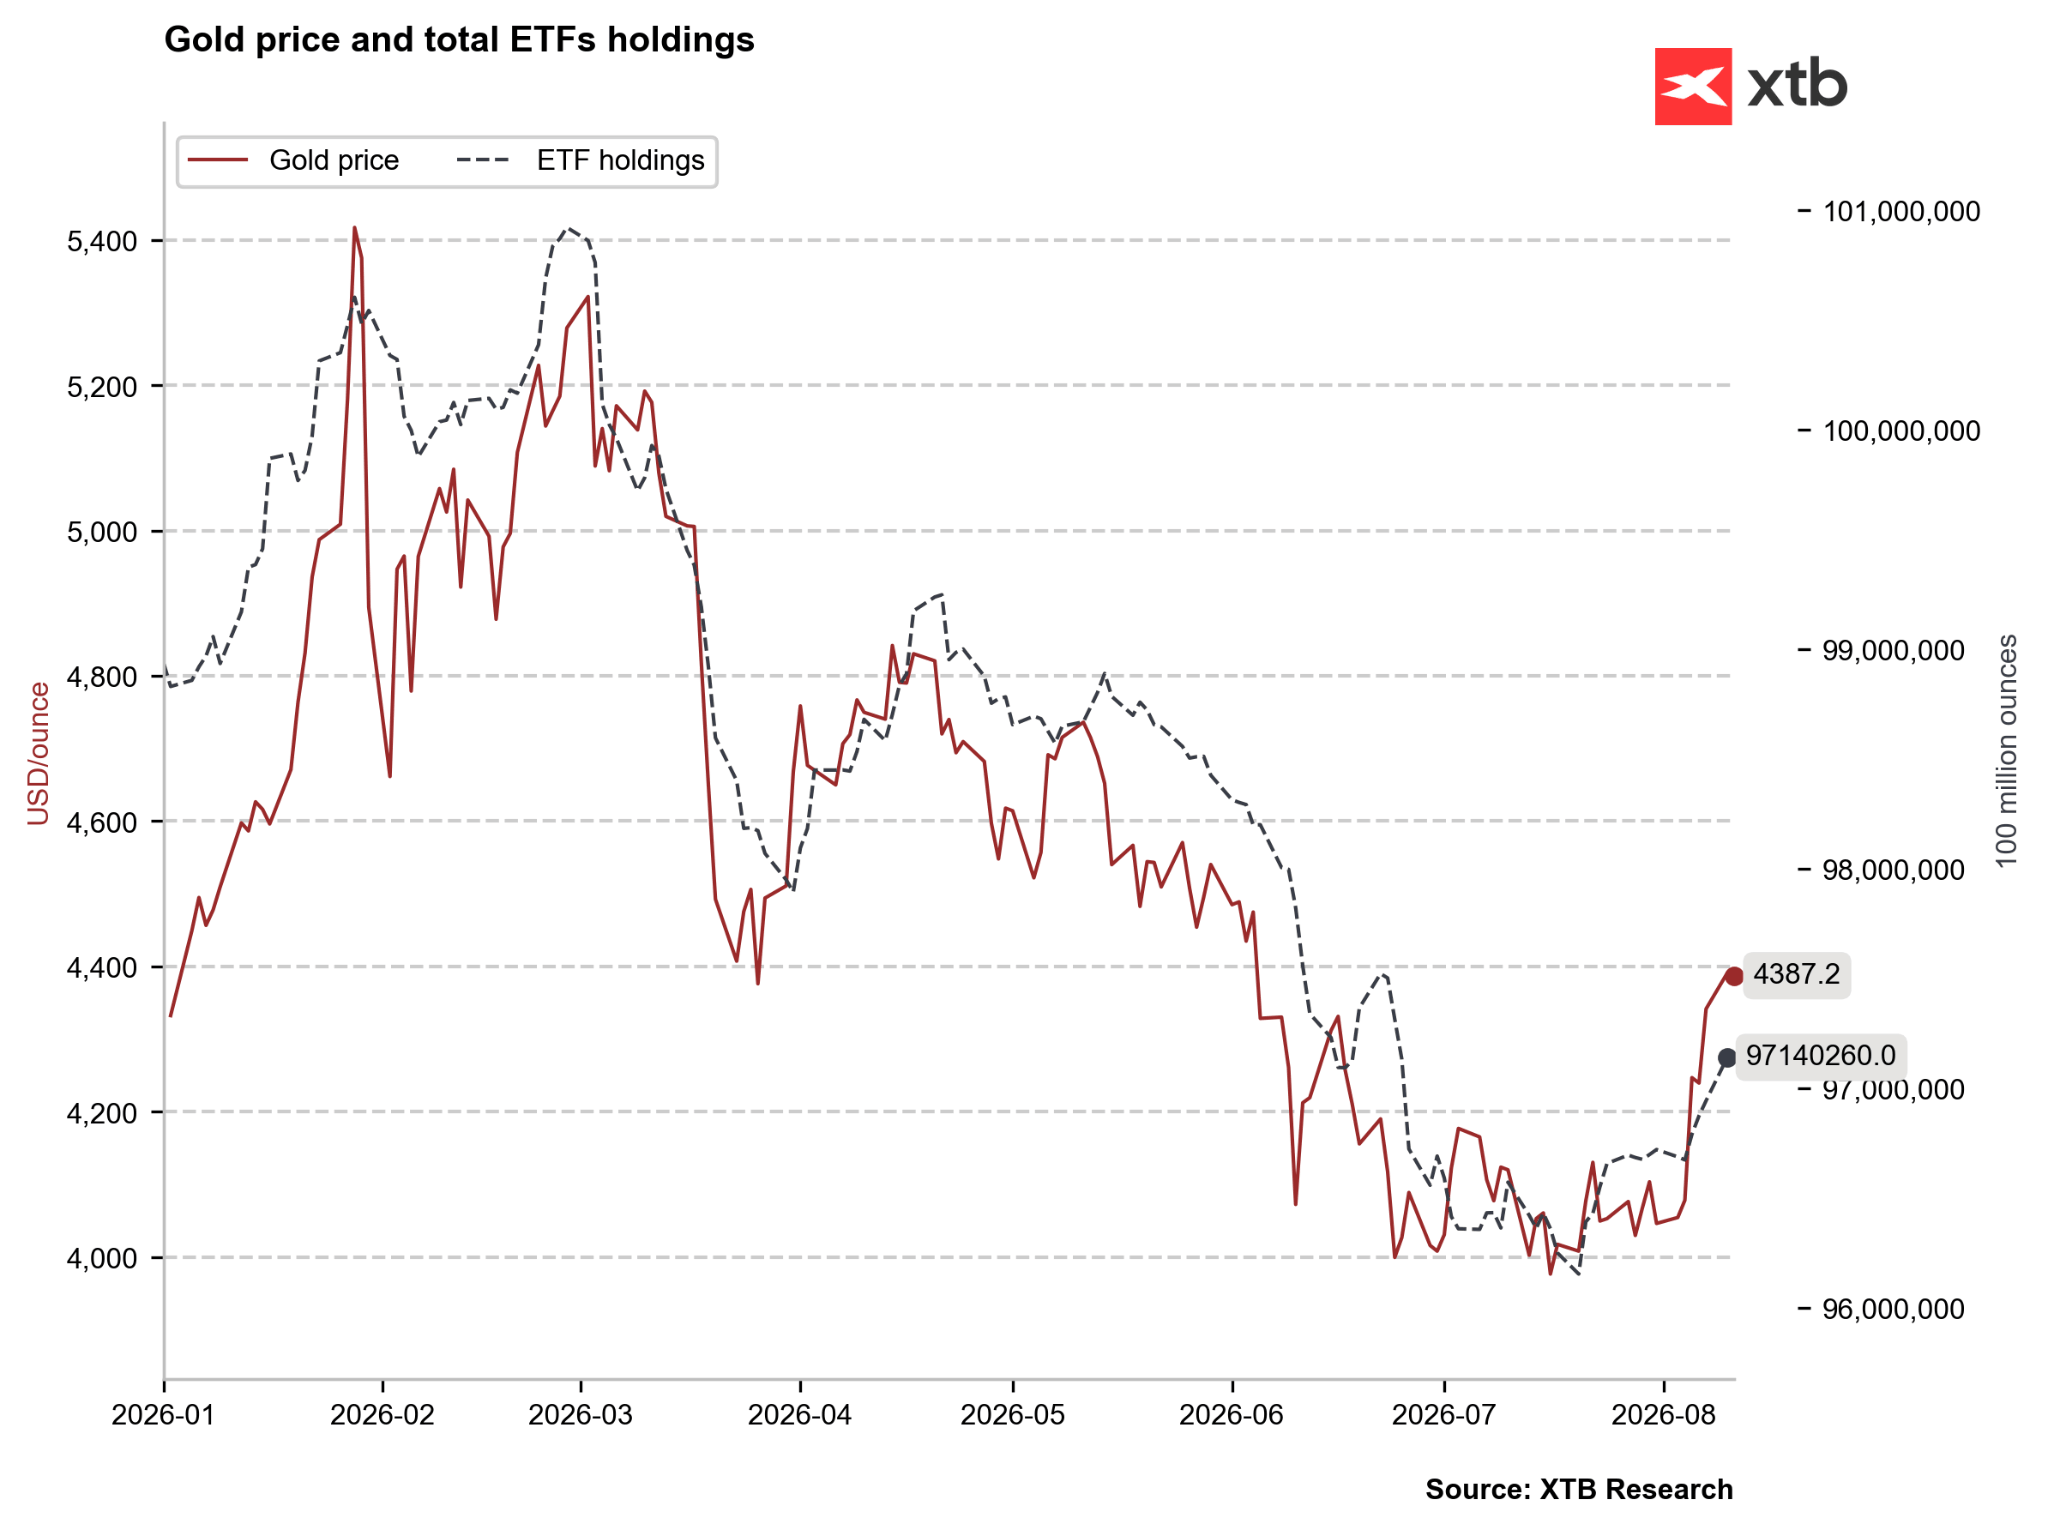
ETF funds have returned to gold purchases, and the current rebound resembles the situation in April. Source: Bloomberg Finance LP, XTB
Gold price and physical demand
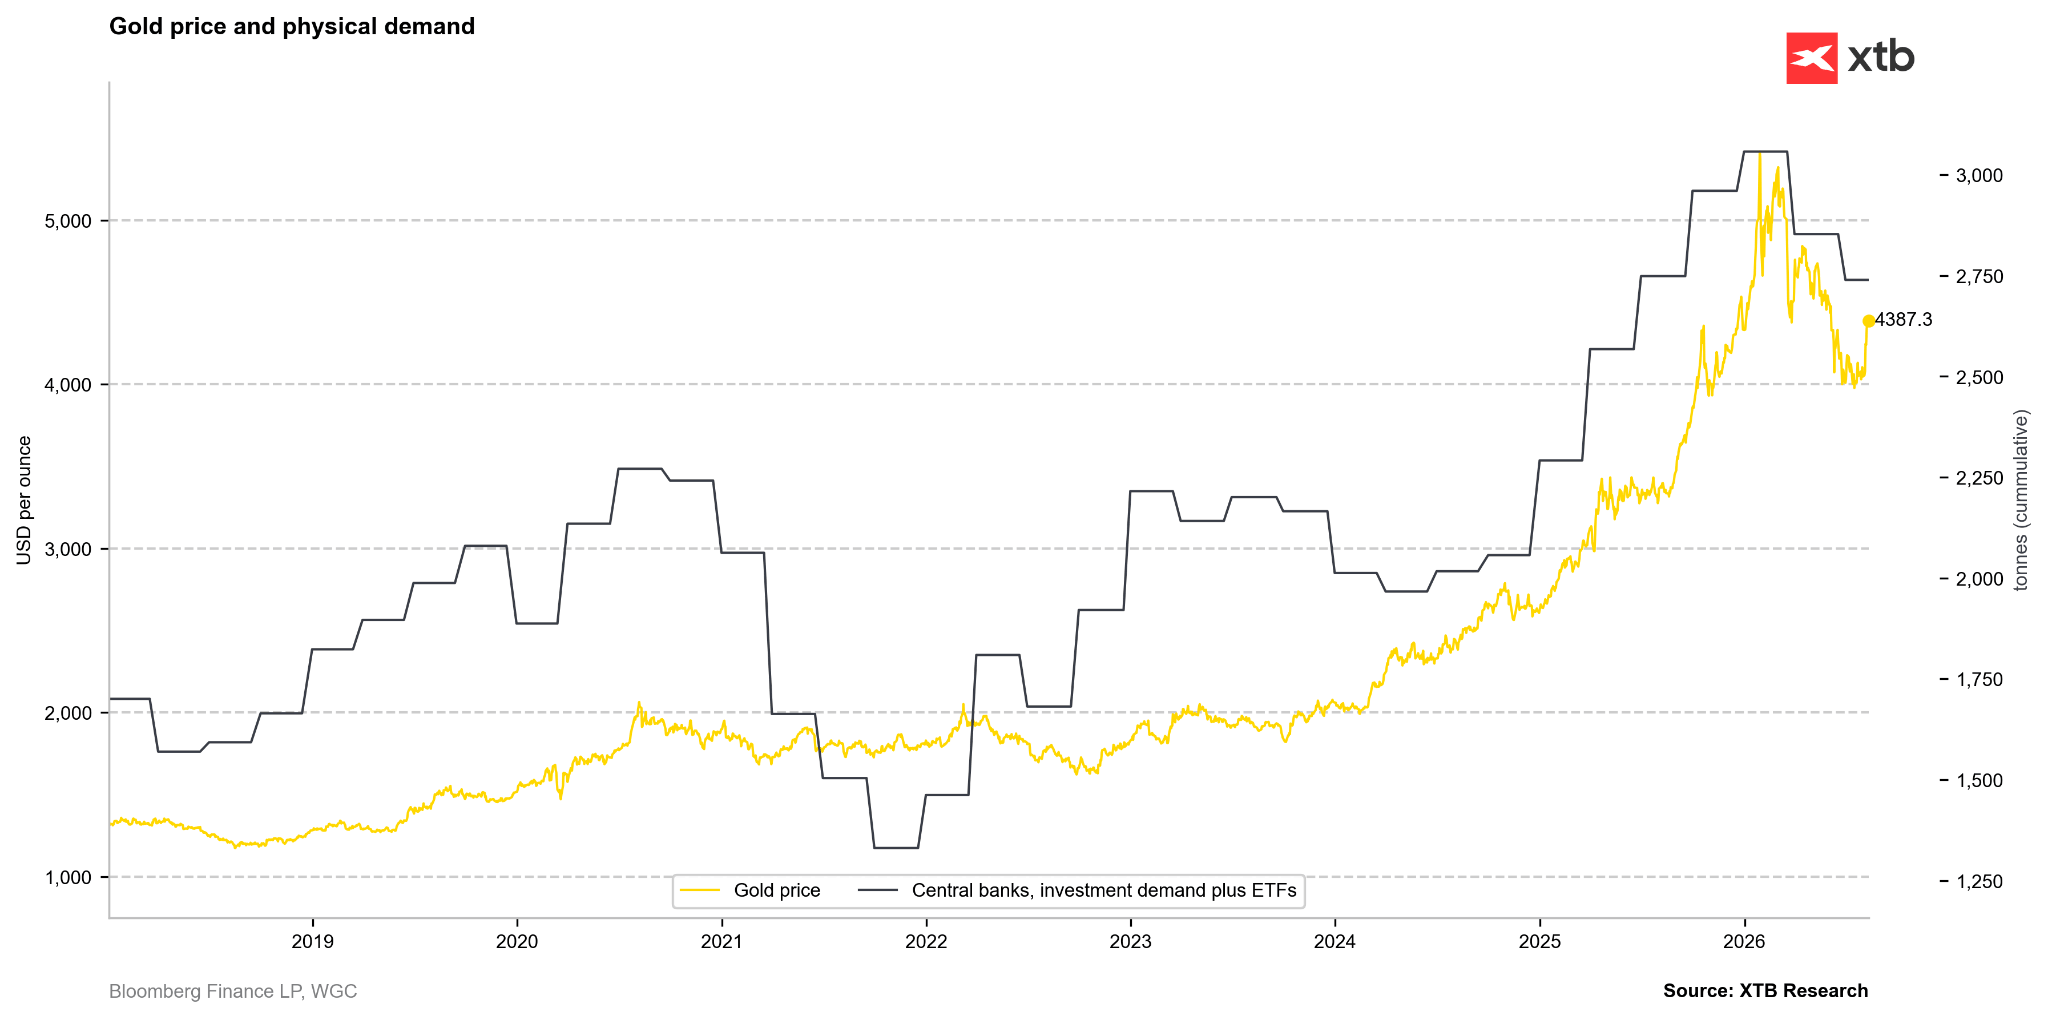
The sum of investment and central bank demand from the last 4 quarters is clearly falling. Currently, the perspective for a rebound in demand for Q3 is quite high, given the sell-off by ETFs in Q2, very low demand for coins, and further strong demand from central banks. Source: Bloomberg Finance LP, XTB
Structure of gold demand
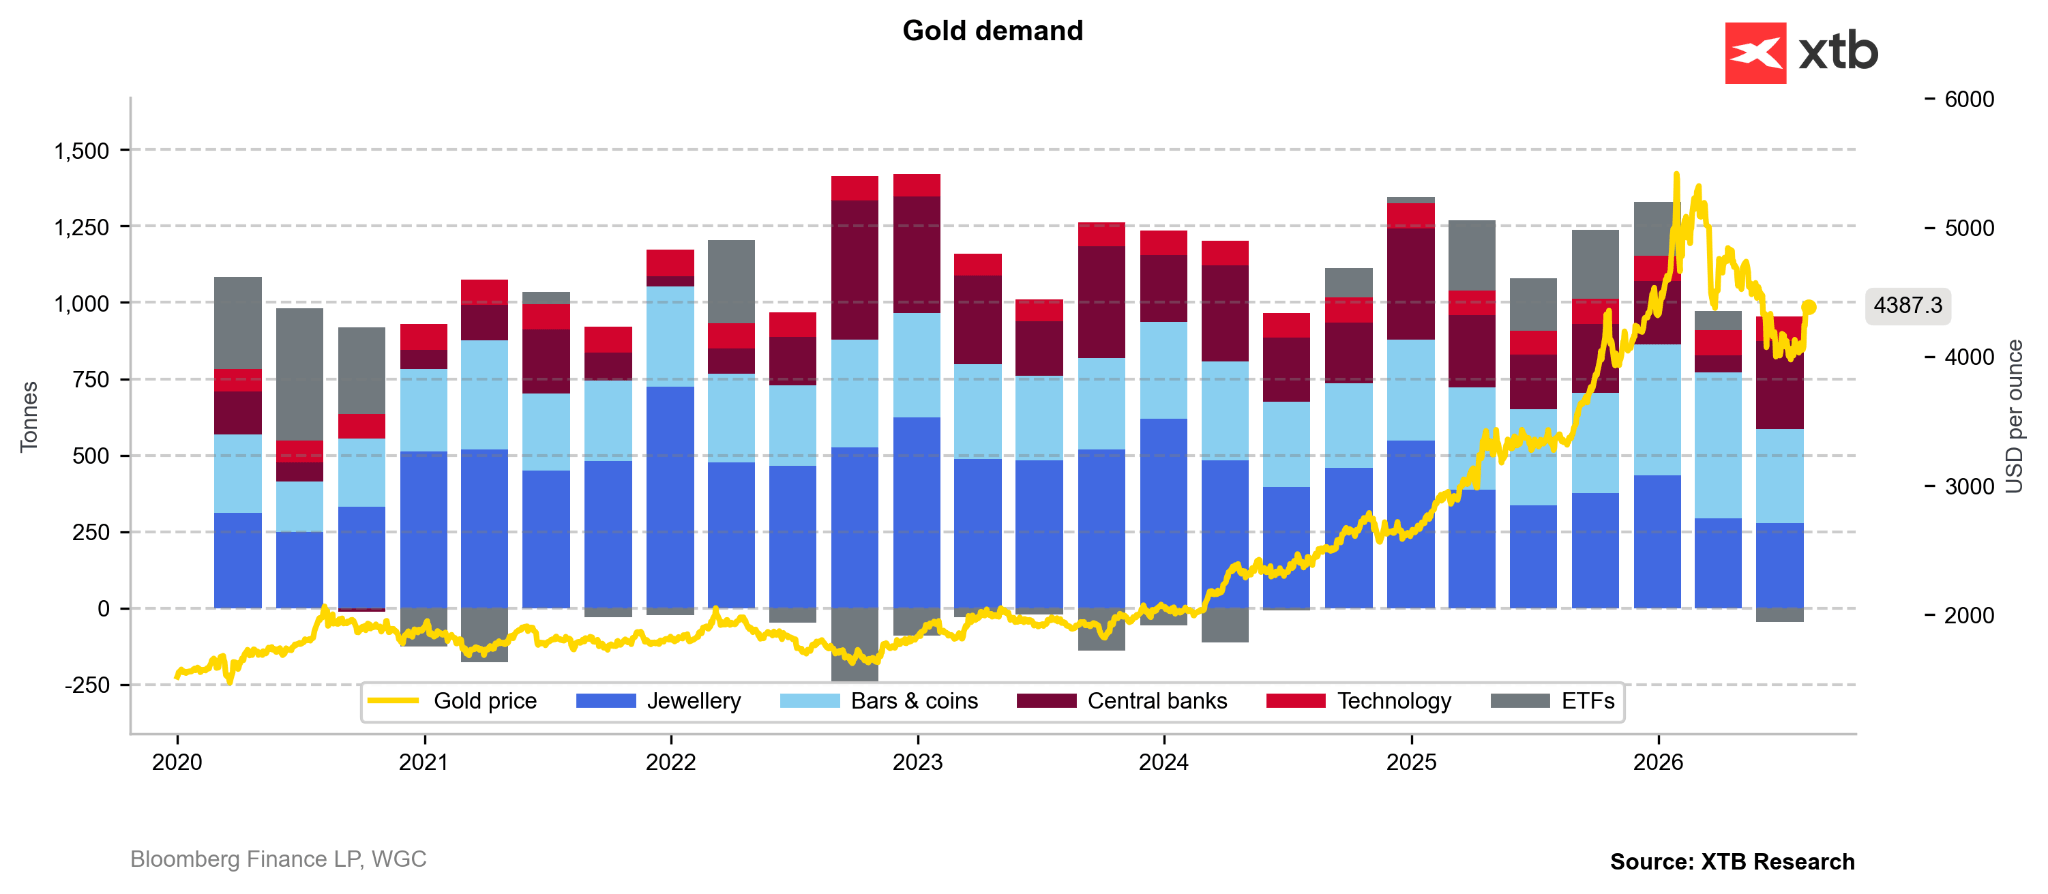
Central banks ensured that demand in Q2 was not one of the lowest in the last dozen or so years. Source: Bloomberg Finance LP, XTB
Technical analysis of gold
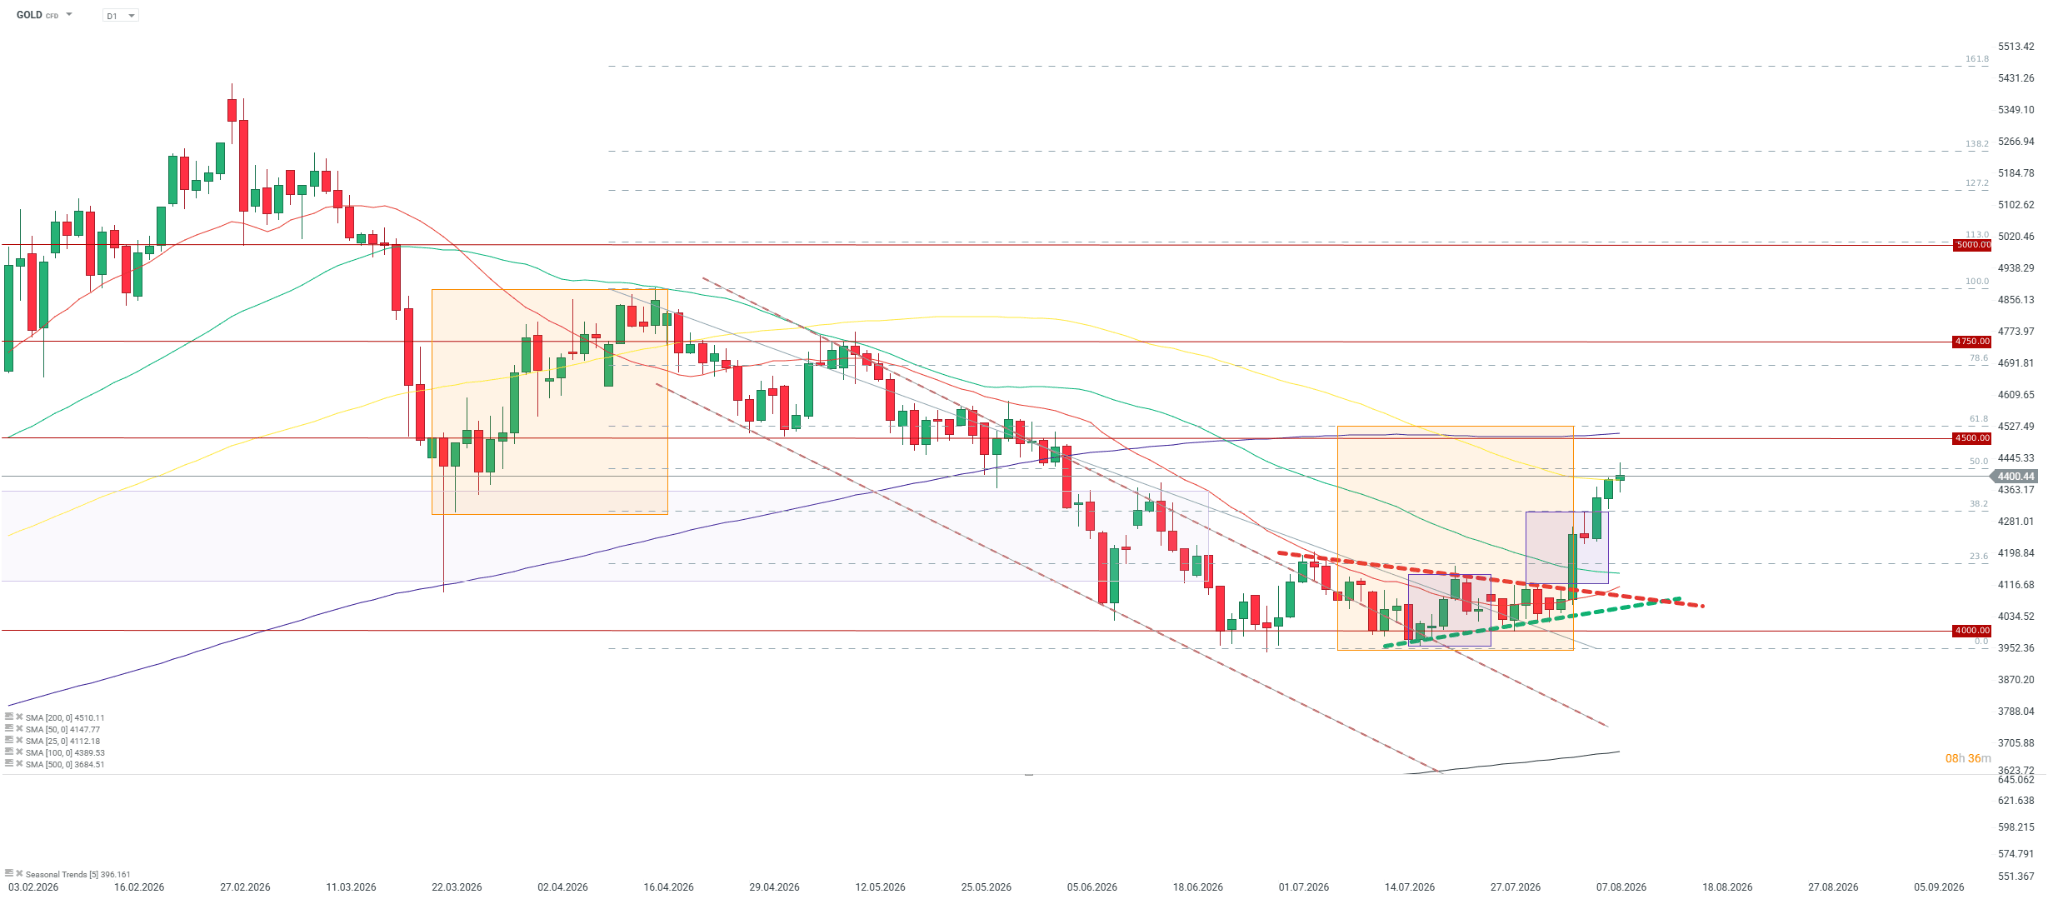
The gold price is currently testing the 100-period average. A close above this level should enable a move into the vicinity of 4500 USD and a potential negation of the last downward impulse. This would open the way to a level of at least 4800 USD by the end of the year, in the face of pressure for rate hikes from the Fed. Source: xStation5
Natgas:
- Natural gas prices in the US rose significantly at the turn of the first and second weeks of August, which may be related to forecasts of slightly higher temperatures in the US in the second half of August.
- Current gas consumption in the United States is at elevated levels, which may lead to testing the range of 2.8-3.0 USD/MMBtu
- At the same time, the state of inventories in the US remains very high, and the current inventory replenishment season will most likely end in the vicinity of 4000 Bcf
- The strong El Nino phenomenon could potentially shift the start of the heating season in the US, which may affect lower prices and declines after strong rollovers of futures contracts.
- The United States is currently a stabilizer in the energy market in the world, also in the form of the largest exporter of LNG gas. Further closure of the Strait of Hormuz causes the demand for American gas in the world to increase.
- European gas prices returned to the level of 60 EUR/MWh with the prospect of further growth. At this point, it does not seem that gas prices in Europe may be exposed to further increases due to uncertainty regarding the filling of storage facilities before November 1. The filling level currently does not exceed 60%, while the target for November 1 is 90%.
- At the same time, however, El Nino may cause temperatures in the northern hemisphere to be higher and reduce the pressure on energy commodity price increases.
Natural gas market in the USA
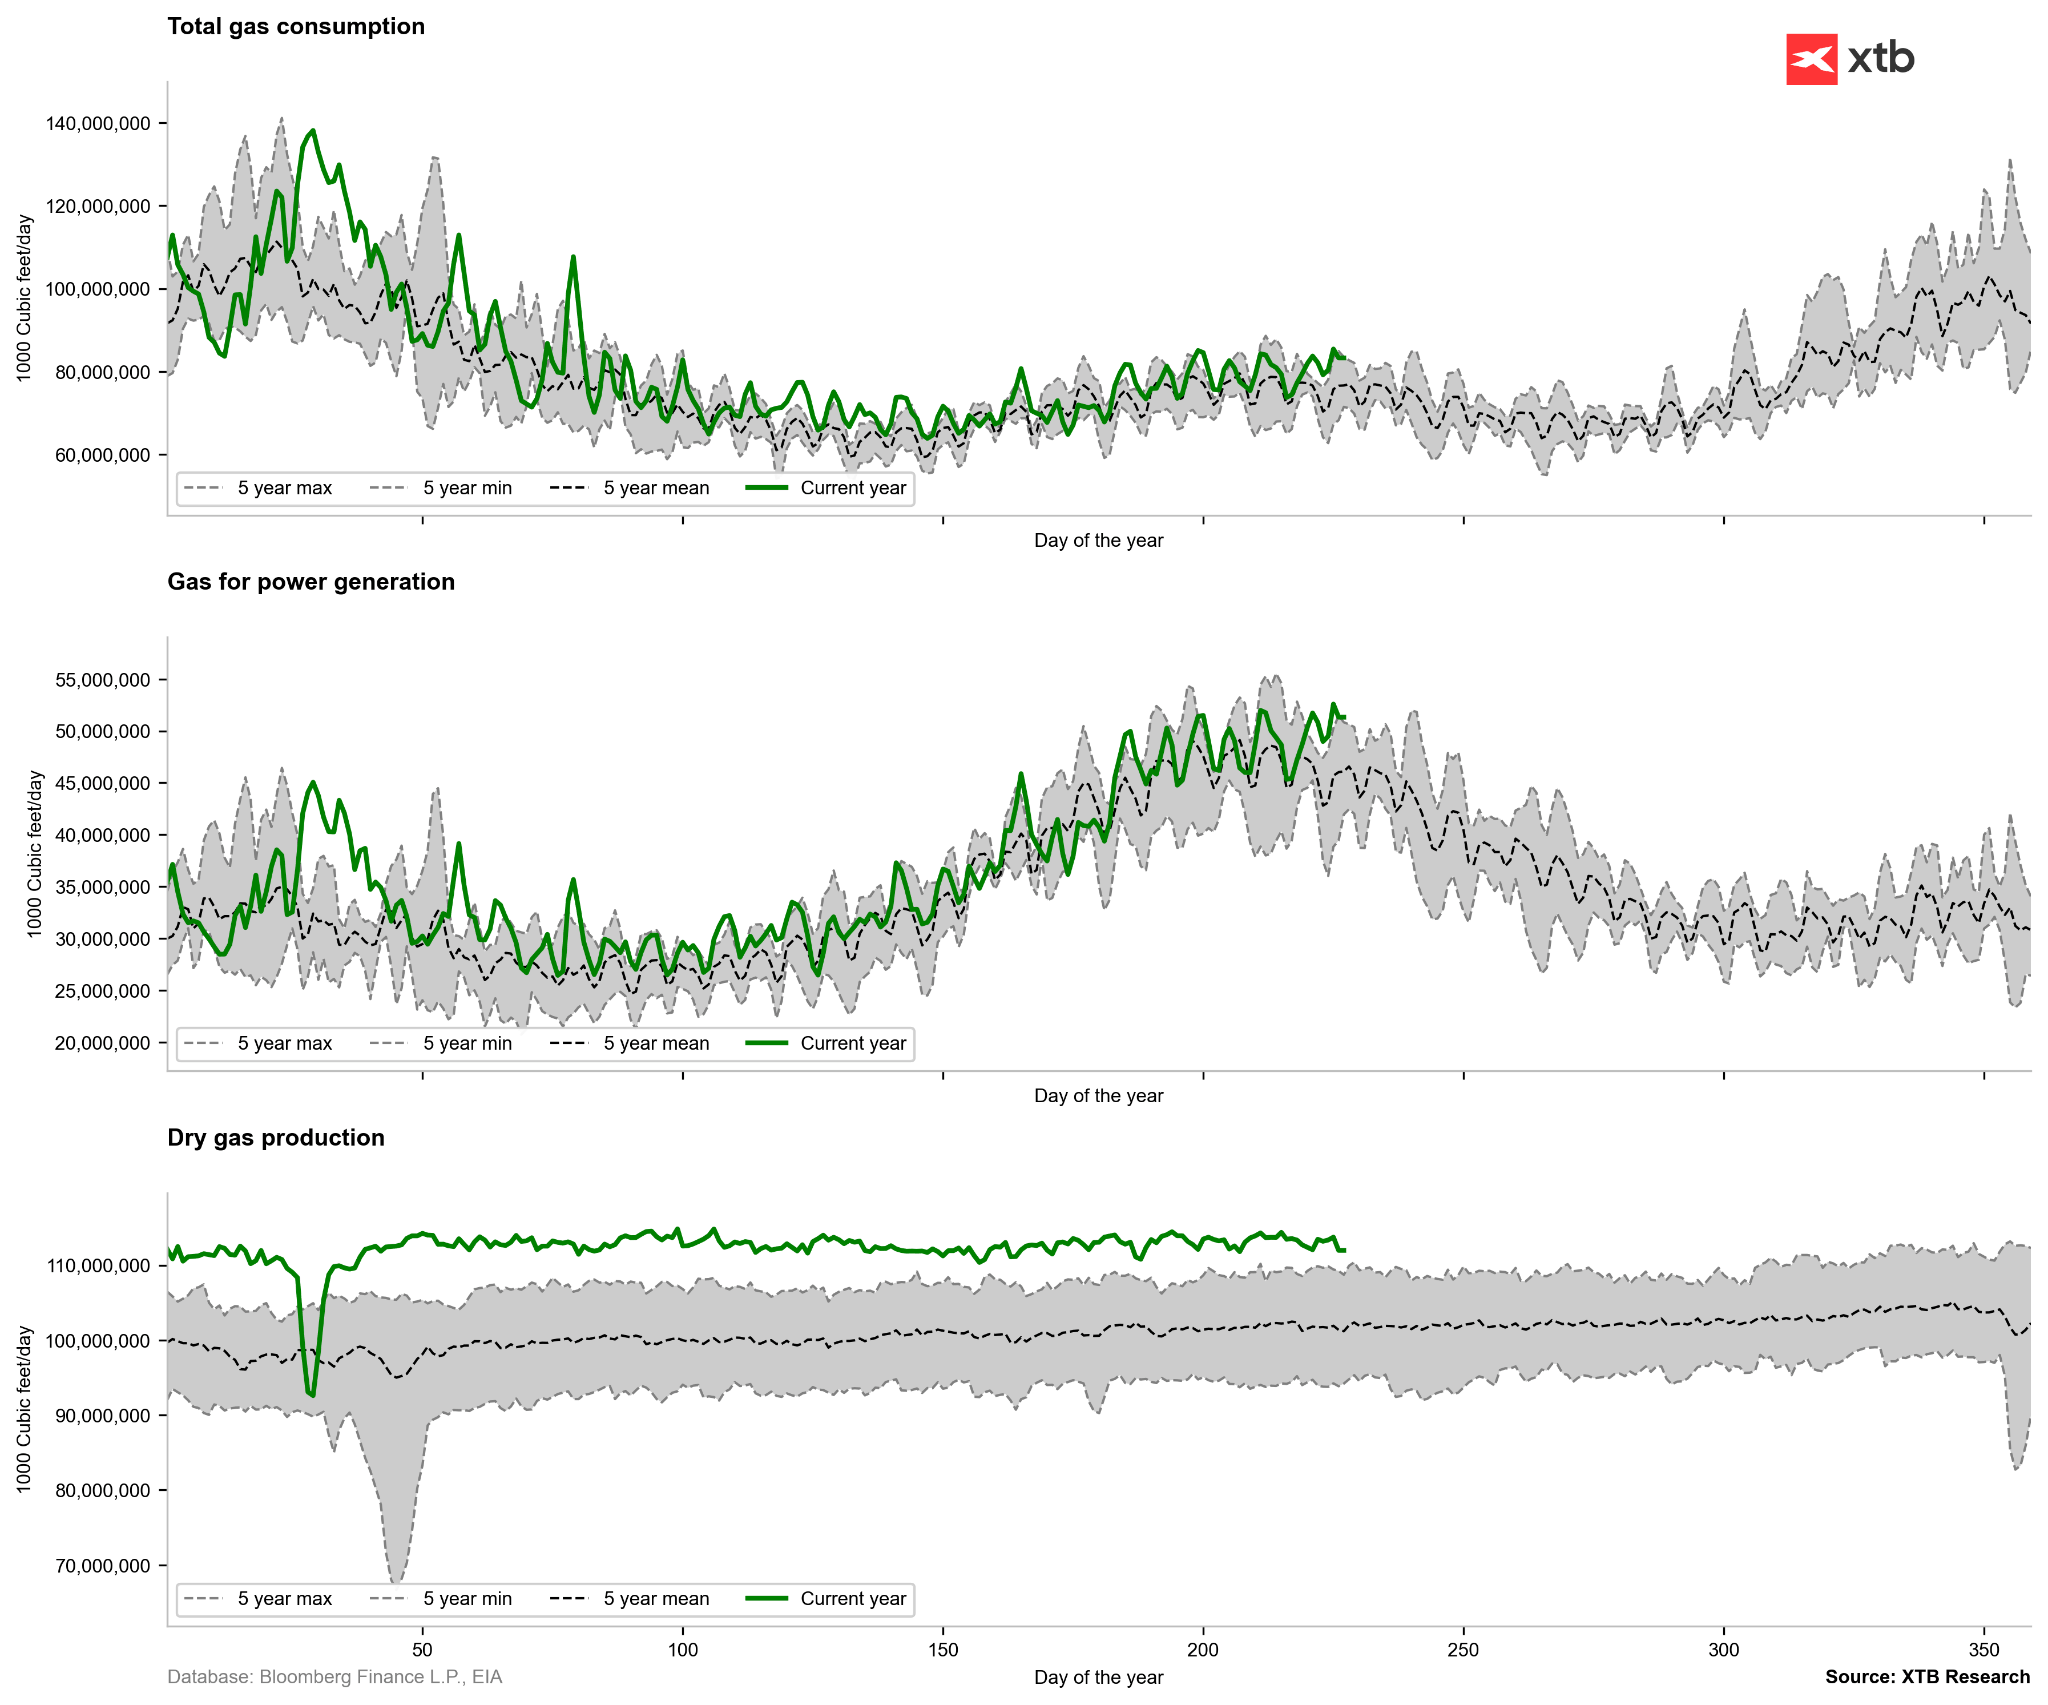
Gas consumption for electricity production purposes is rising to the highest level this year. Additionally, overall demand is hitting the 5-year maximum, which may mean short-term pressure on price increases. Source: Bloomberg Finance LP, XTB
Seasonality of natural gas inventories in the USA
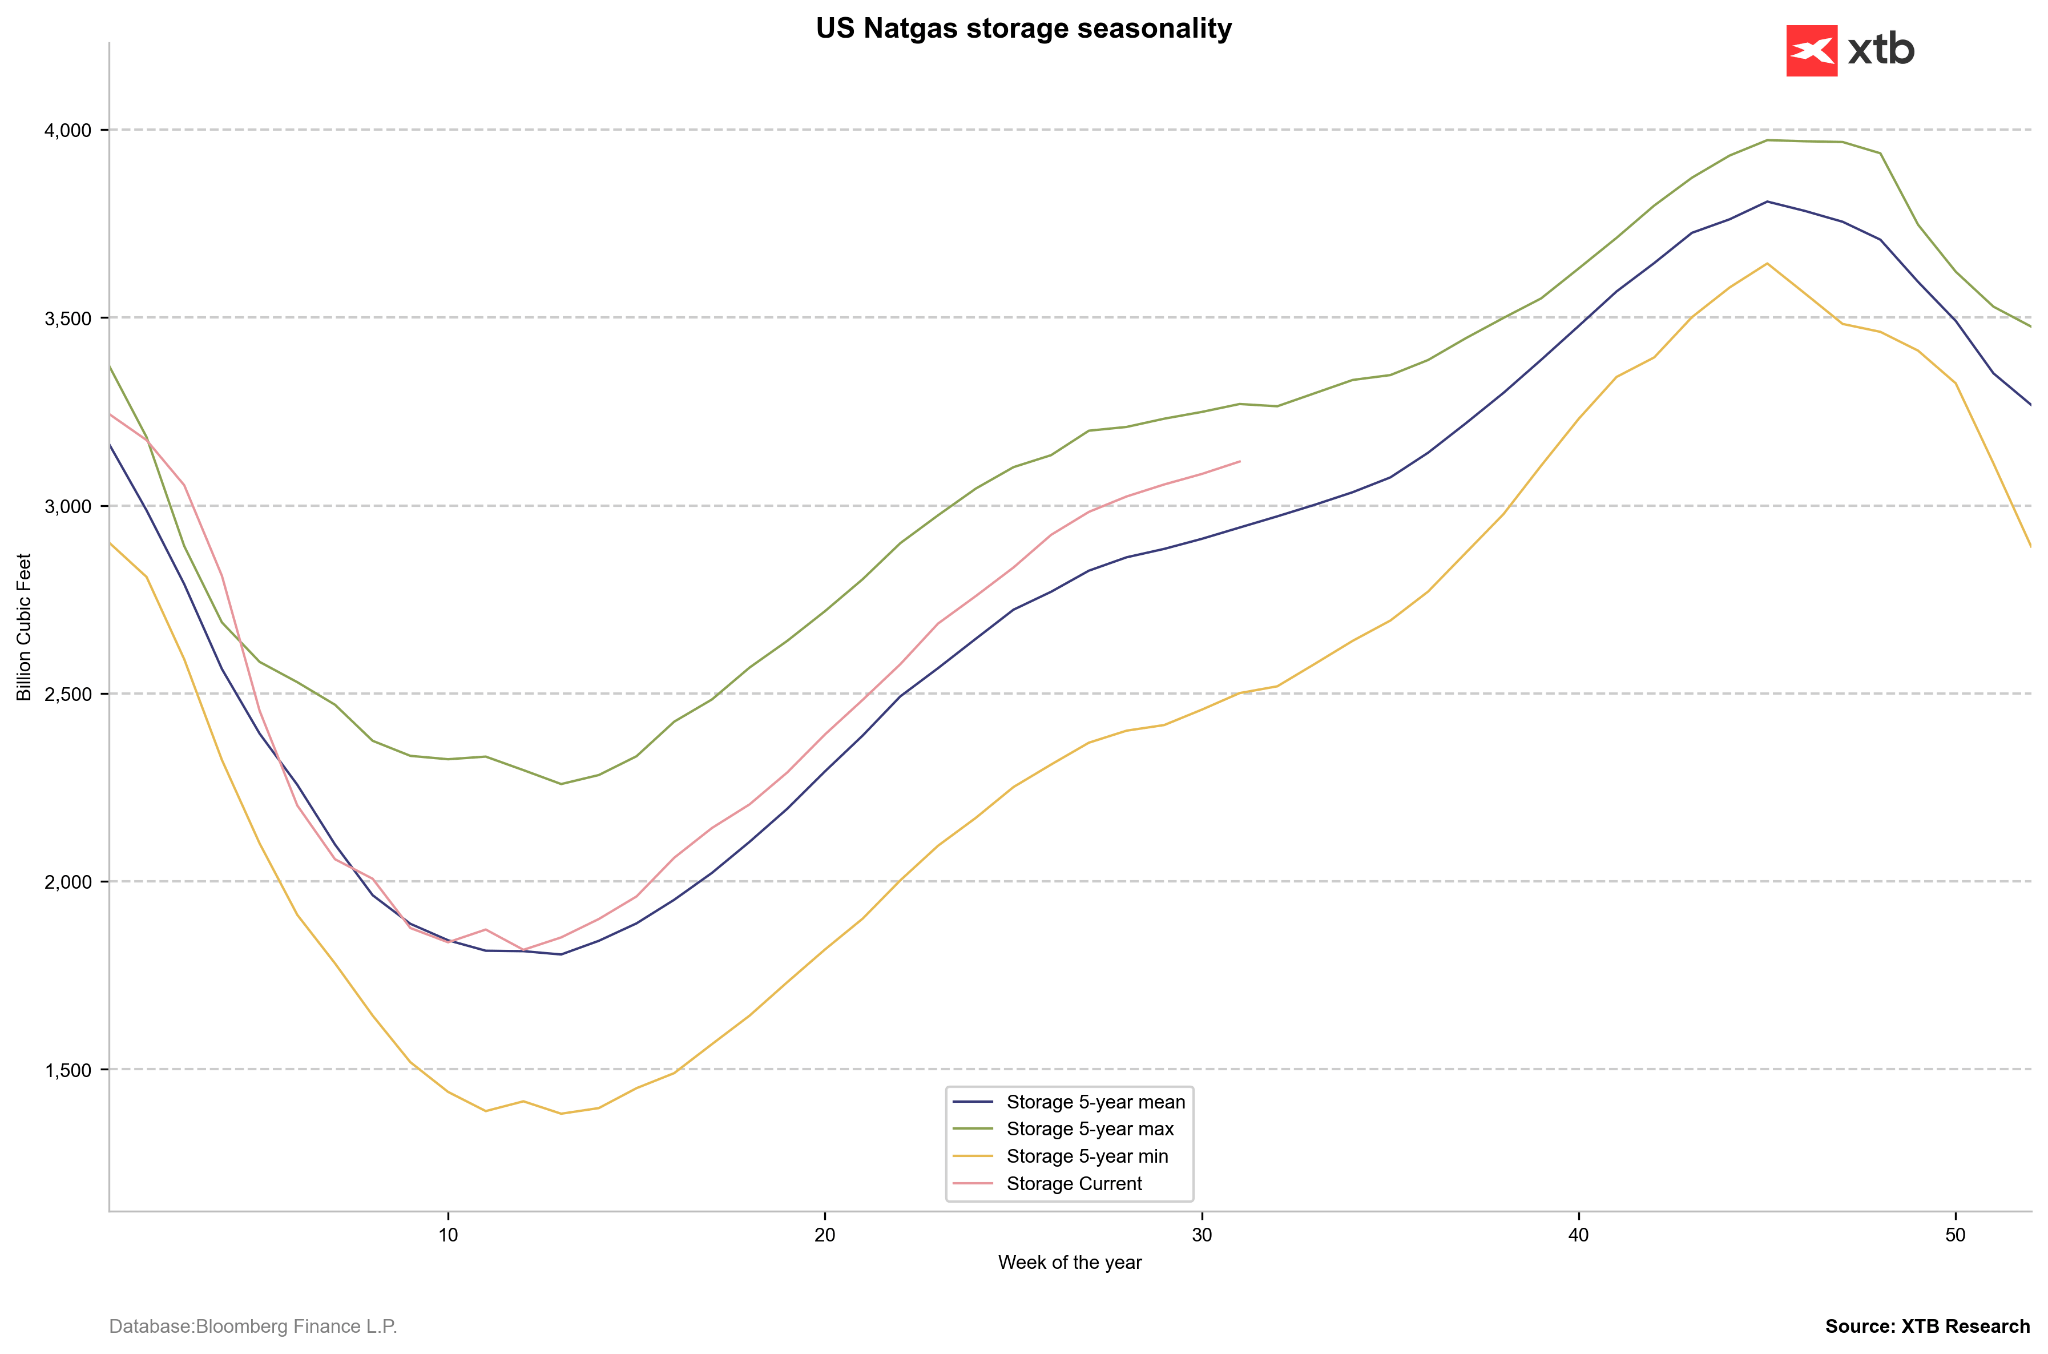
The implied change in inventories for this week is 0, which means very high gas consumption. This may mean that the rate of inventory growth may slow down somewhat, which is, however, consistent with seasonality. Nevertheless, high gas production and the shift of the heating season could lead to inventory growth above 4000 Bcf, which could clearly limit the level of prices after strong rollovers just before the start of the heating season. Source: Bloomberg Finance LP, XTB
EMISS (CO2 emission allowances):
- Prices for CO2 emission allowances in Europe remained below 70 EUR per ton for a long time this year due to uncertainty regarding the future of the ETS2 system.
- Increased demand for electricity (high temperatures, construction of AI centers) also causes increased demand for allowances.
- July is usually a month in which the supply of allowances at auctions falls or is adjusted due to the holiday period (lower market liquidity).
- Prices are currently remaining below 100 EUR/MWh due to limited economic growth and trade tensions. The construction of RES in Europe is also progressing, although weather fluctuations also cause an increase in the volatility of emission prices.
- The long-term perspective indicates an increase in emission prices up to 130-150 EUR/t by 2030, due to decreasing supply. Nevertheless, regulatory uncertainty means that the price increase is not certain at present.
- In mid-July, the EU presented a proposal for a reform of the ETS1 system, however, the changes are cosmetic in nature – they assume greater flexibility and a slight slowing down of the pace of phasing out free allowances, which was supposed to start this year.
- The ETS2 system is to start in 2028, but formal auctions are to take place already in 2027. To prevent a price shock and the shifting of high costs to the consumer, a frontloading of emission allowances is to be carried out in 2027 and 130% of the annual limit of allowances will be offered.
Seasonality of CO2 emission allowance prices
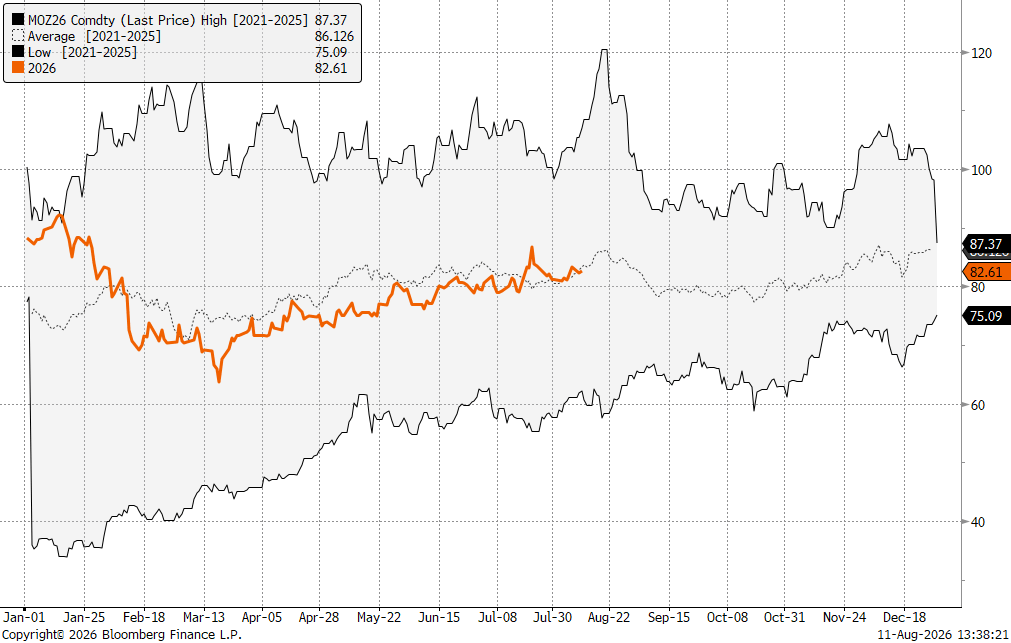
Nominal seasonality of allowance prices indicates an increase until the third week of August, and then a clear reduction and the start of an increase in October. Source: Bloomberg Finance LP, XTB
Technical analysis of the CO2 emission market
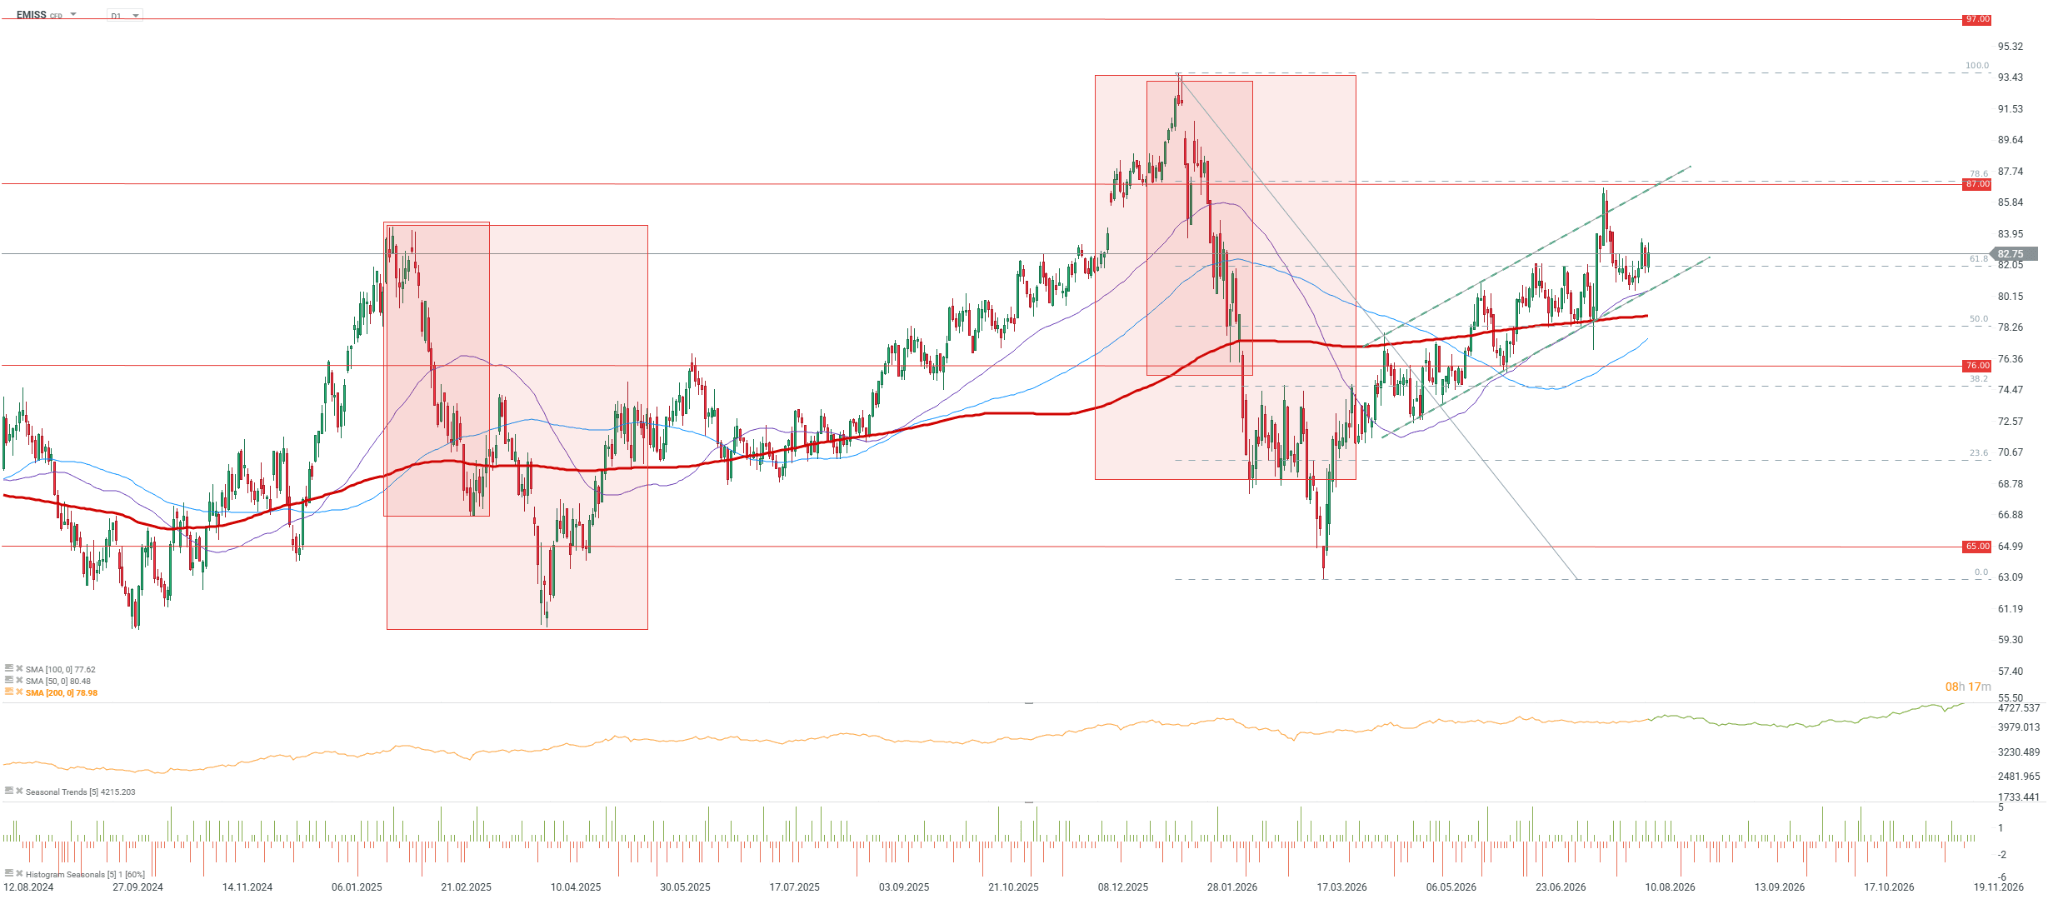
Key support for emission prices is located in the range of 80–82 EUR per ton, while the potential of the current upward movement reaches from 85 to 87 EUR. Source: xStation5


Daily Summary: Earnings Season Kicks Off on Wall Street Amid Mixed Sentiment



Market Wrap: European Stocks Rise as Banks Beat Earnings Expectations


🚩 US100 loses 0.7%



Morning Wrap: Tech Crash in Asia and Hawkish Central Banks in the Shadow of an Oil Shock (13.10.2026)