


- Bitcoin’s largest holders have shifted from selling to accumulation after offloading roughly $40 billion worth of BTC since October 2025, potentially signaling that one of the market’s key sources of supply pressure is fading.
- Institutional capital is starting to return to crypto, with digital asset funds recording a fifth consecutive week of inflows and U.S. spot Bitcoin ETFs attracting around $853.5 million over the past week.
- The macro backdrop is becoming less restrictive for BTC following weaker U.S. labor market data, although a more decisive move toward $100,000 would likely require a stronger shift in Fed expectations toward lower interest rates.
- Despite improving fund flows and renewed whale accumulation, Bitcoin continues to significantly underperform Wall Street, suggesting that the current setup looks more like a bottoming process than the confirmed start of a new bull market.

- Bitcoin’s largest holders have shifted from selling to accumulation after offloading roughly $40 billion worth of BTC since October 2025, potentially signaling that one of the market’s key sources of supply pressure is fading.
- Institutional capital is starting to return to crypto, with digital asset funds recording a fifth consecutive week of inflows and U.S. spot Bitcoin ETFs attracting around $853.5 million over the past week.
- The macro backdrop is becoming less restrictive for BTC following weaker U.S. labor market data, although a more decisive move toward $100,000 would likely require a stronger shift in Fed expectations toward lower interest rates.
- Despite improving fund flows and renewed whale accumulation, Bitcoin continues to significantly underperform Wall Street, suggesting that the current setup looks more like a bottoming process than the confirmed start of a new bull market.
Have Bitcoin whales stopped selling?
One of the most important changes currently taking place in the market is the behavior of the largest BTC holders. According to CoinShares data, whales have sold roughly $40 billion worth of Bitcoin since October 2025, creating one of the largest sources of selling pressure in the current cycle. That process, however, has started to fade. CoinShares points to three consecutive weeks of accumulation among the largest holders, a pattern that has historically appeared at similar stages of Bitcoin’s four-year cycles. If this shift proves sustainable, the market could be losing one of the key sources of supply that has weighed on prices in recent months.
Since October 2025, whales have sold around $40 billion worth of BTC. Bitcoin has now recorded three consecutive weeks of accumulation, and if the price begins to recover toward $70,000, the cyclical low may already be behind the market. This does not automatically mean the beginning of a new bull market. Until the autumn, consolidation and a potential test of the $80,000 area may be more likely, although a decline toward $50,000 or below also remains possible. This distinction is important: the end of a major selling wave removes a significant headwind, but does not by itself create enough demand to establish a sustainable uptrend. If fresh supply emerges, Bitcoin could deepen its losses and experience a percentage decline comparable with previous bear markets.
Capital is slowly returning to crypto funds
A more positive signal comes from capital flows. Digital asset investment products attracted approximately $1.05 billion in the week ended August 7, marking the fifth consecutive week of inflows. This looks particularly interesting against the preceding eight-week period, during which investors withdrew a record $8 billion. In a relatively short period, the market has therefore shifted from aggressive exposure reduction toward renewed accumulation.
A similar picture can be seen in U.S. spot Bitcoin ETFs. They attracted around $853.5 million in the week ended August 7, the strongest result since mid-April. BlackRock’s iShares Bitcoin Trust alone accounted for roughly $700 million of those flows, while its net assets stood at approximately $48.5 billion. Combined with the fading selling pressure from whales, this creates a more constructive supply-demand setup than just a few weeks ago.
The largest holders are reducing the amount of BTC they bring to market just as institutional capital is beginning to return. However, investor interest in equities and equity funds remains clearly stronger than demand for Bitcoin and the broader crypto market.
The Fed remains key to a return toward $100,000
U.S. interest rates remain the most important macroeconomic catalyst for Bitcoin. Weaker labor market data have reduced expectations for further Fed rate hikes, helping BTC rebound from this year’s lows. According to the CoinShares scenario, however, simply scaling back rate-hike expectations may not be enough to trigger a much larger move. A return toward $100,000 would likely require clearer signs of deterioration in employment and a more pronounced shift in market expectations toward lower interest rates. The market therefore remains in an uncomfortable position.
The data are weak enough to ease concerns about further monetary tightening, but not yet weak enough to force the Fed into a decisively more dovish stance. The Jackson Hole symposium could provide more clues, although CoinShares does not expect an explicitly dovish message from the central bank. Oil remains another important variable. De-escalation around Iran could reduce energy prices and inflationary pressure, indirectly improving the macro environment for Bitcoin, while renewed escalation could quickly reverse this effect.
Bitcoin continues to lag Wall Street
This is the strongest argument against declaring the end of crypto weakness too early. Glassnode points out that Bitcoin has yet to regain relative strength against major equity indices. Over the past 90 days, BTC has fallen around 20%, while the S&P 500 has gained approximately 5%.
The divergence is even greater year-to-date. Bitcoin is down around 35% and altcoins have lost an average of 57%, while the Nasdaq and Russell 2000 are up approximately 38% and 31%, respectively. Some commodities have performed even better, with gold up around 60%, copper 66%, and silver 107%.
Glassnode describes the current setup as an equity-led market. In other words, improving flows and whale accumulation are constructive signals, but the real test will come when Bitcoin starts consistently outperforming the major stock indices.
July brought an important shift — what about regulation?
The first signs of such a change may have emerged in July. During a sharp correction in AI and semiconductor stocks, chip ETFs fell by more than 20% and the Nasdaq 100 declined almost 7%. Over the same month, Bitcoin gained around 9% and Ethereum rose 20%. Just a few months earlier, such divergence would have been much less likely because of BTC’s very strong correlation with technology stocks. Bitcoin’s 90-day correlation with the Nasdaq reached 0.89 in May, while K33 Research data showed that its 30-day correlation had fallen to 0.43 by late July.
BlackRock argues that Bitcoin’s declining dependence on equities increases its potential usefulness as a portfolio diversifier. This could become one of the more important trends to watch over the coming months. If Bitcoin can continue to perform relatively well during Nasdaq corrections, its narrative may gradually shift away from being perceived primarily as a “technology risk-on asset” and toward becoming a more independent asset class.
The weaker part of the picture remains U.S. regulation. The probability of the CLARITY Act passing this year has fallen to only around 15% on Polymarket. The Senate is not expected to vote on the crypto market-structure bill before the summer recess. CoinShares nevertheless believes that a delay would be more problematic for Ethereum and stablecoin-related projects than for Bitcoin itself. At the same time, the debate in Washington is increasingly shifting away from questions about crypto’s legitimacy or its place in the financial system and toward ethical concerns — particularly whether public officials should be allowed to issue and profit from their own tokens.
Has Bitcoin already built a bottom?
The market picture has become noticeably more constructive, but one element is still missing: confirmation from price action. On the one hand, the multibillion-dollar selling wave from the largest holders is fading, funds are attracting capital again, and the interest-rate environment is becoming less restrictive. On the other hand, Bitcoin remains one of the weakest major assets of 2026 and has yet to regain an advantage over equities.
The current setup therefore looks more like a bottoming process than the confirmed beginning of another bull-market leg. What is particularly interesting, however, is the changing market structure: lower supply from whales is meeting returning institutional demand at the same time as Bitcoin’s correlation with the Nasdaq begins to decline.
The next phase will largely depend on three factors: Fed policy, the behavior of the largest BTC holders, and whether inflows into ETFs and other investment products can be sustained. If these factors are accompanied by improving relative strength against Wall Street, the argument that Bitcoin remains trapped in an equity-dominated market will begin to weaken. Only then would there be much stronger evidence that the current cycle of Bitcoin weakness has genuinely come to an end.
Bitcoin chart (D1 interval)
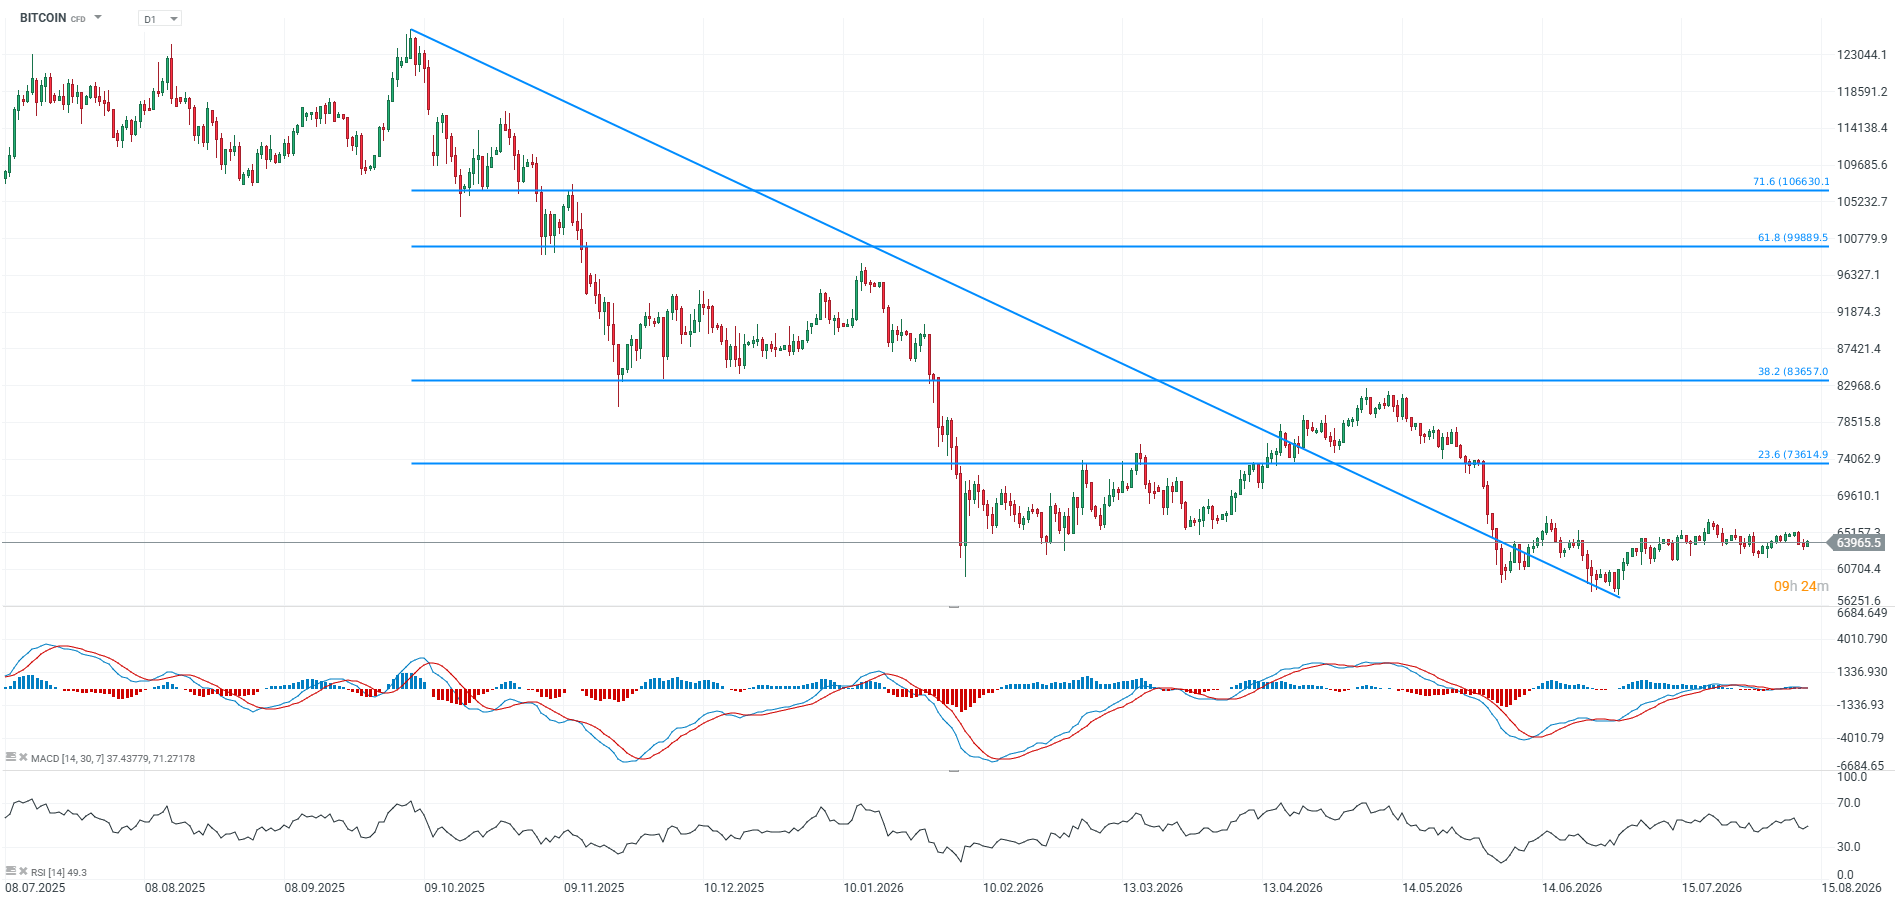
BTC remains well below the 23.6% Fibonacci retracement of the latest major downward move, located around $73,000. Bitcoin is clearly struggling to initiate a strong rebound from current levels and has twice encountered significant resistance around $65,000–66,000. The $60,000–62,000 area appears to be an important support zone, reinforced by previous price reactions. A break below $60,000 could point to another stronger bearish impulse and potentially new lows in the ongoing bear market.
Source: xStation5
Bitcoin ETF flows
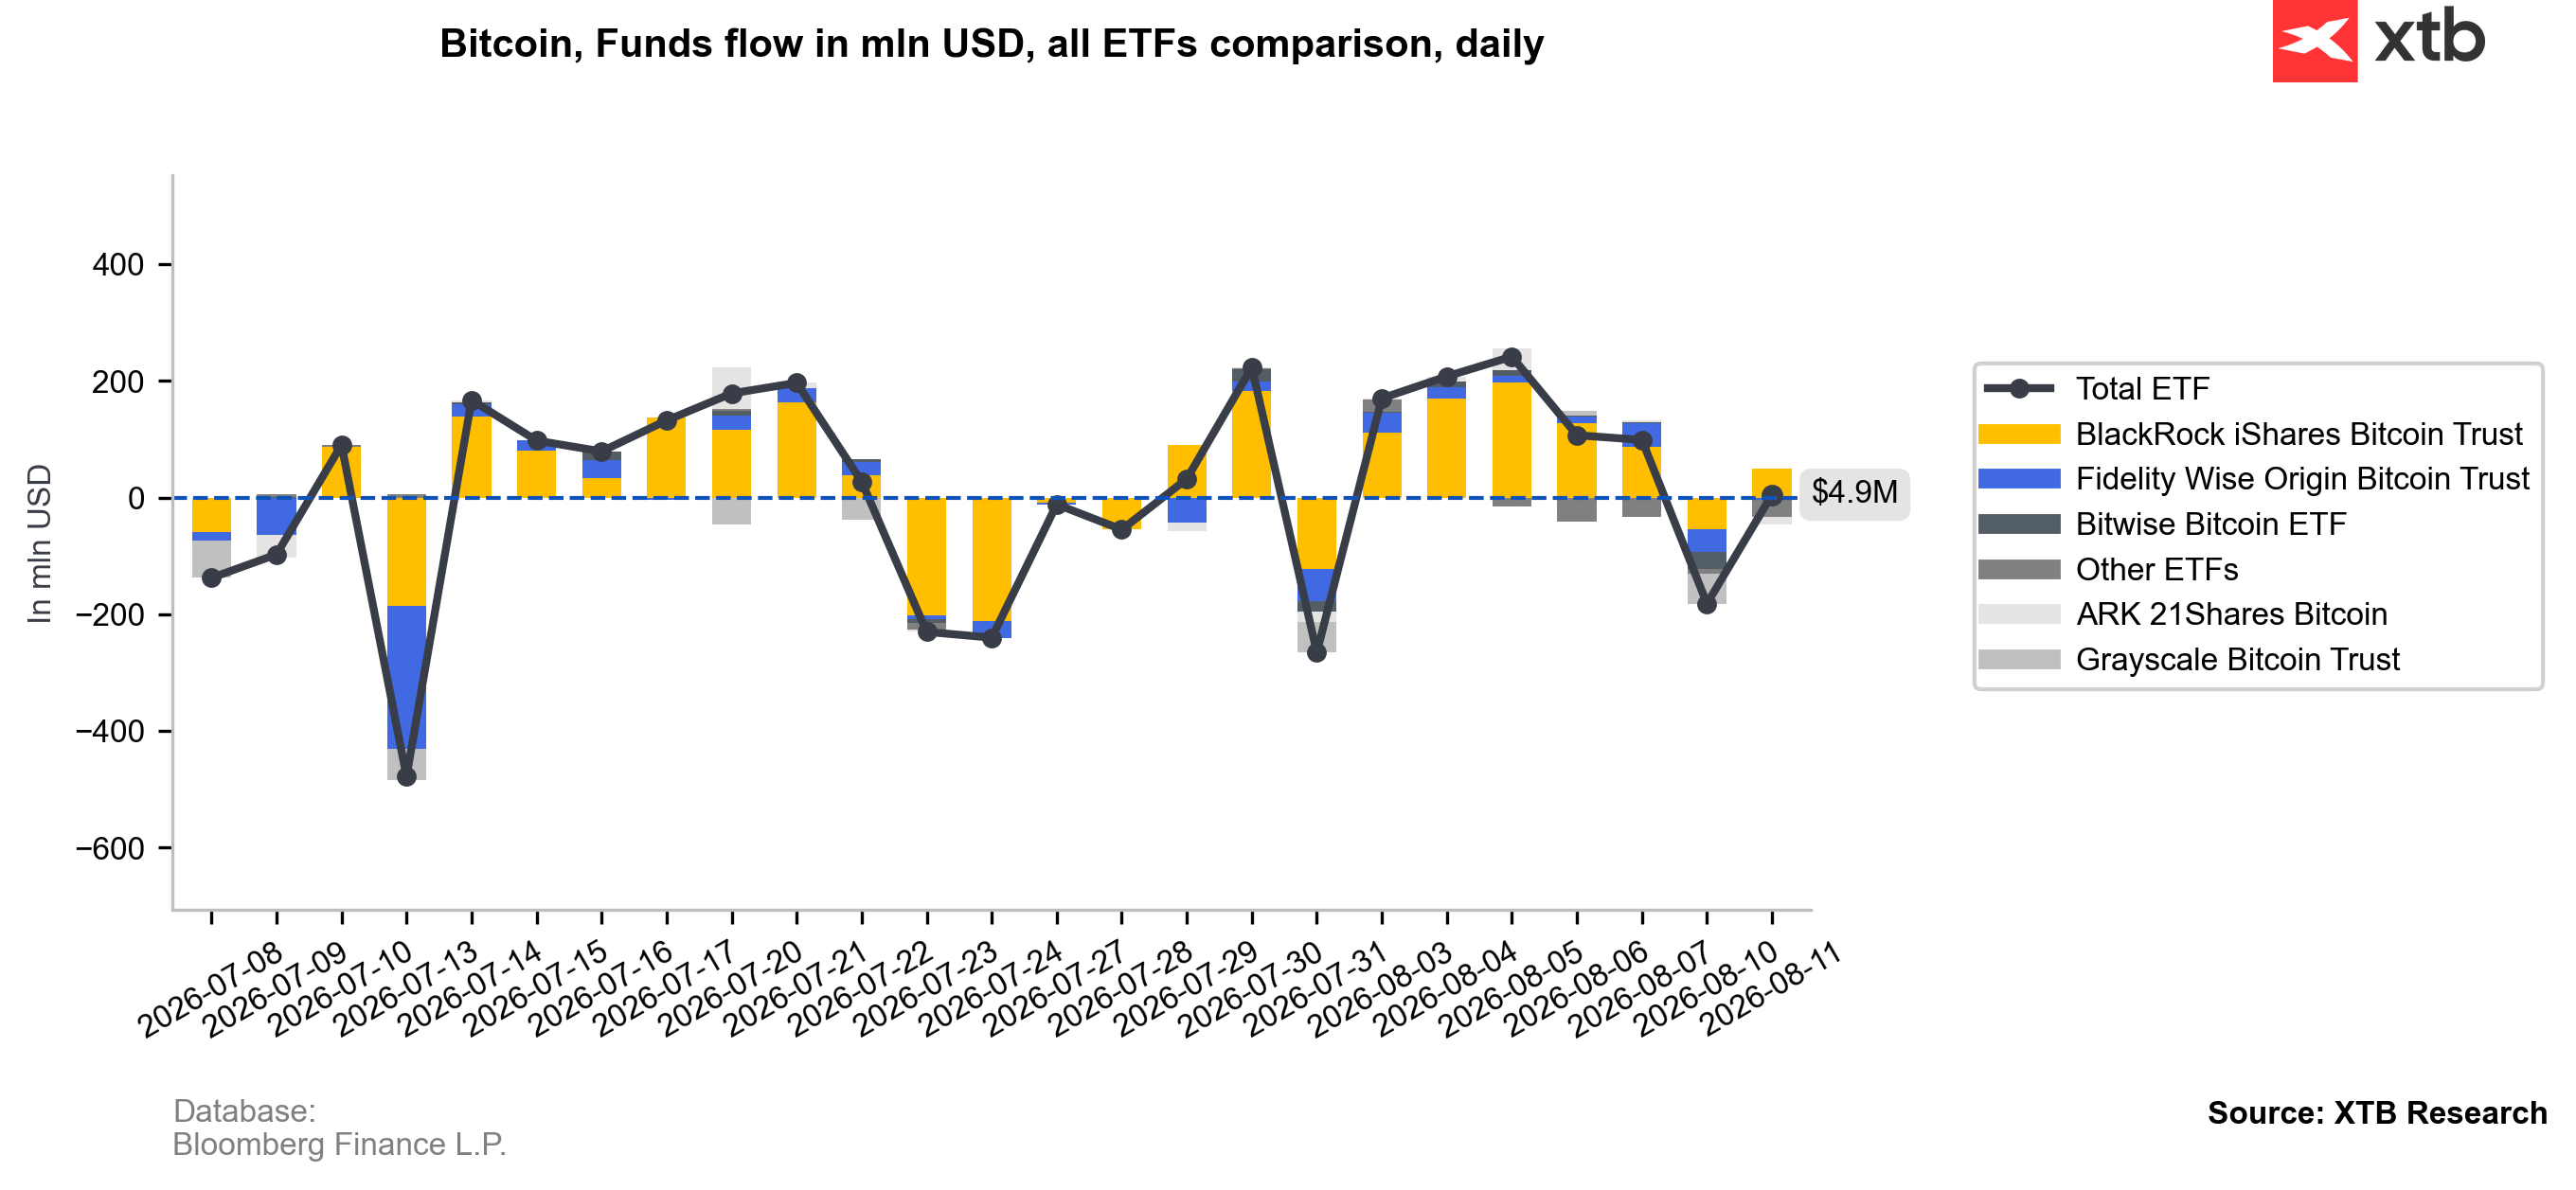
Recent weeks have brought significant volatility in spot Bitcoin ETF flows, but the latest reading of approximately +$4.9 million effectively points to a balance between demand and supply. This represents a clear improvement from the previous session, when outflows reached roughly $180 million, although a single positive day is not enough to confirm a lasting return of capital.
Looking more broadly, July and early August saw large inflows exceeding $200 million alternate with equally sharp outflows, highlighting the lack of clear conviction among investors. BlackRock remains the main source of demand during inflow sessions, while flows across other funds are considerably less consistent — a pattern that is also visible over longer periods. For Bitcoin, the more constructive signal would therefore not be one exceptionally strong inflow session, but a series of positive days showing that institutional investors are once again systematically building exposure.
Source: XTB Research
Cumulative Bitcoin ETF flows
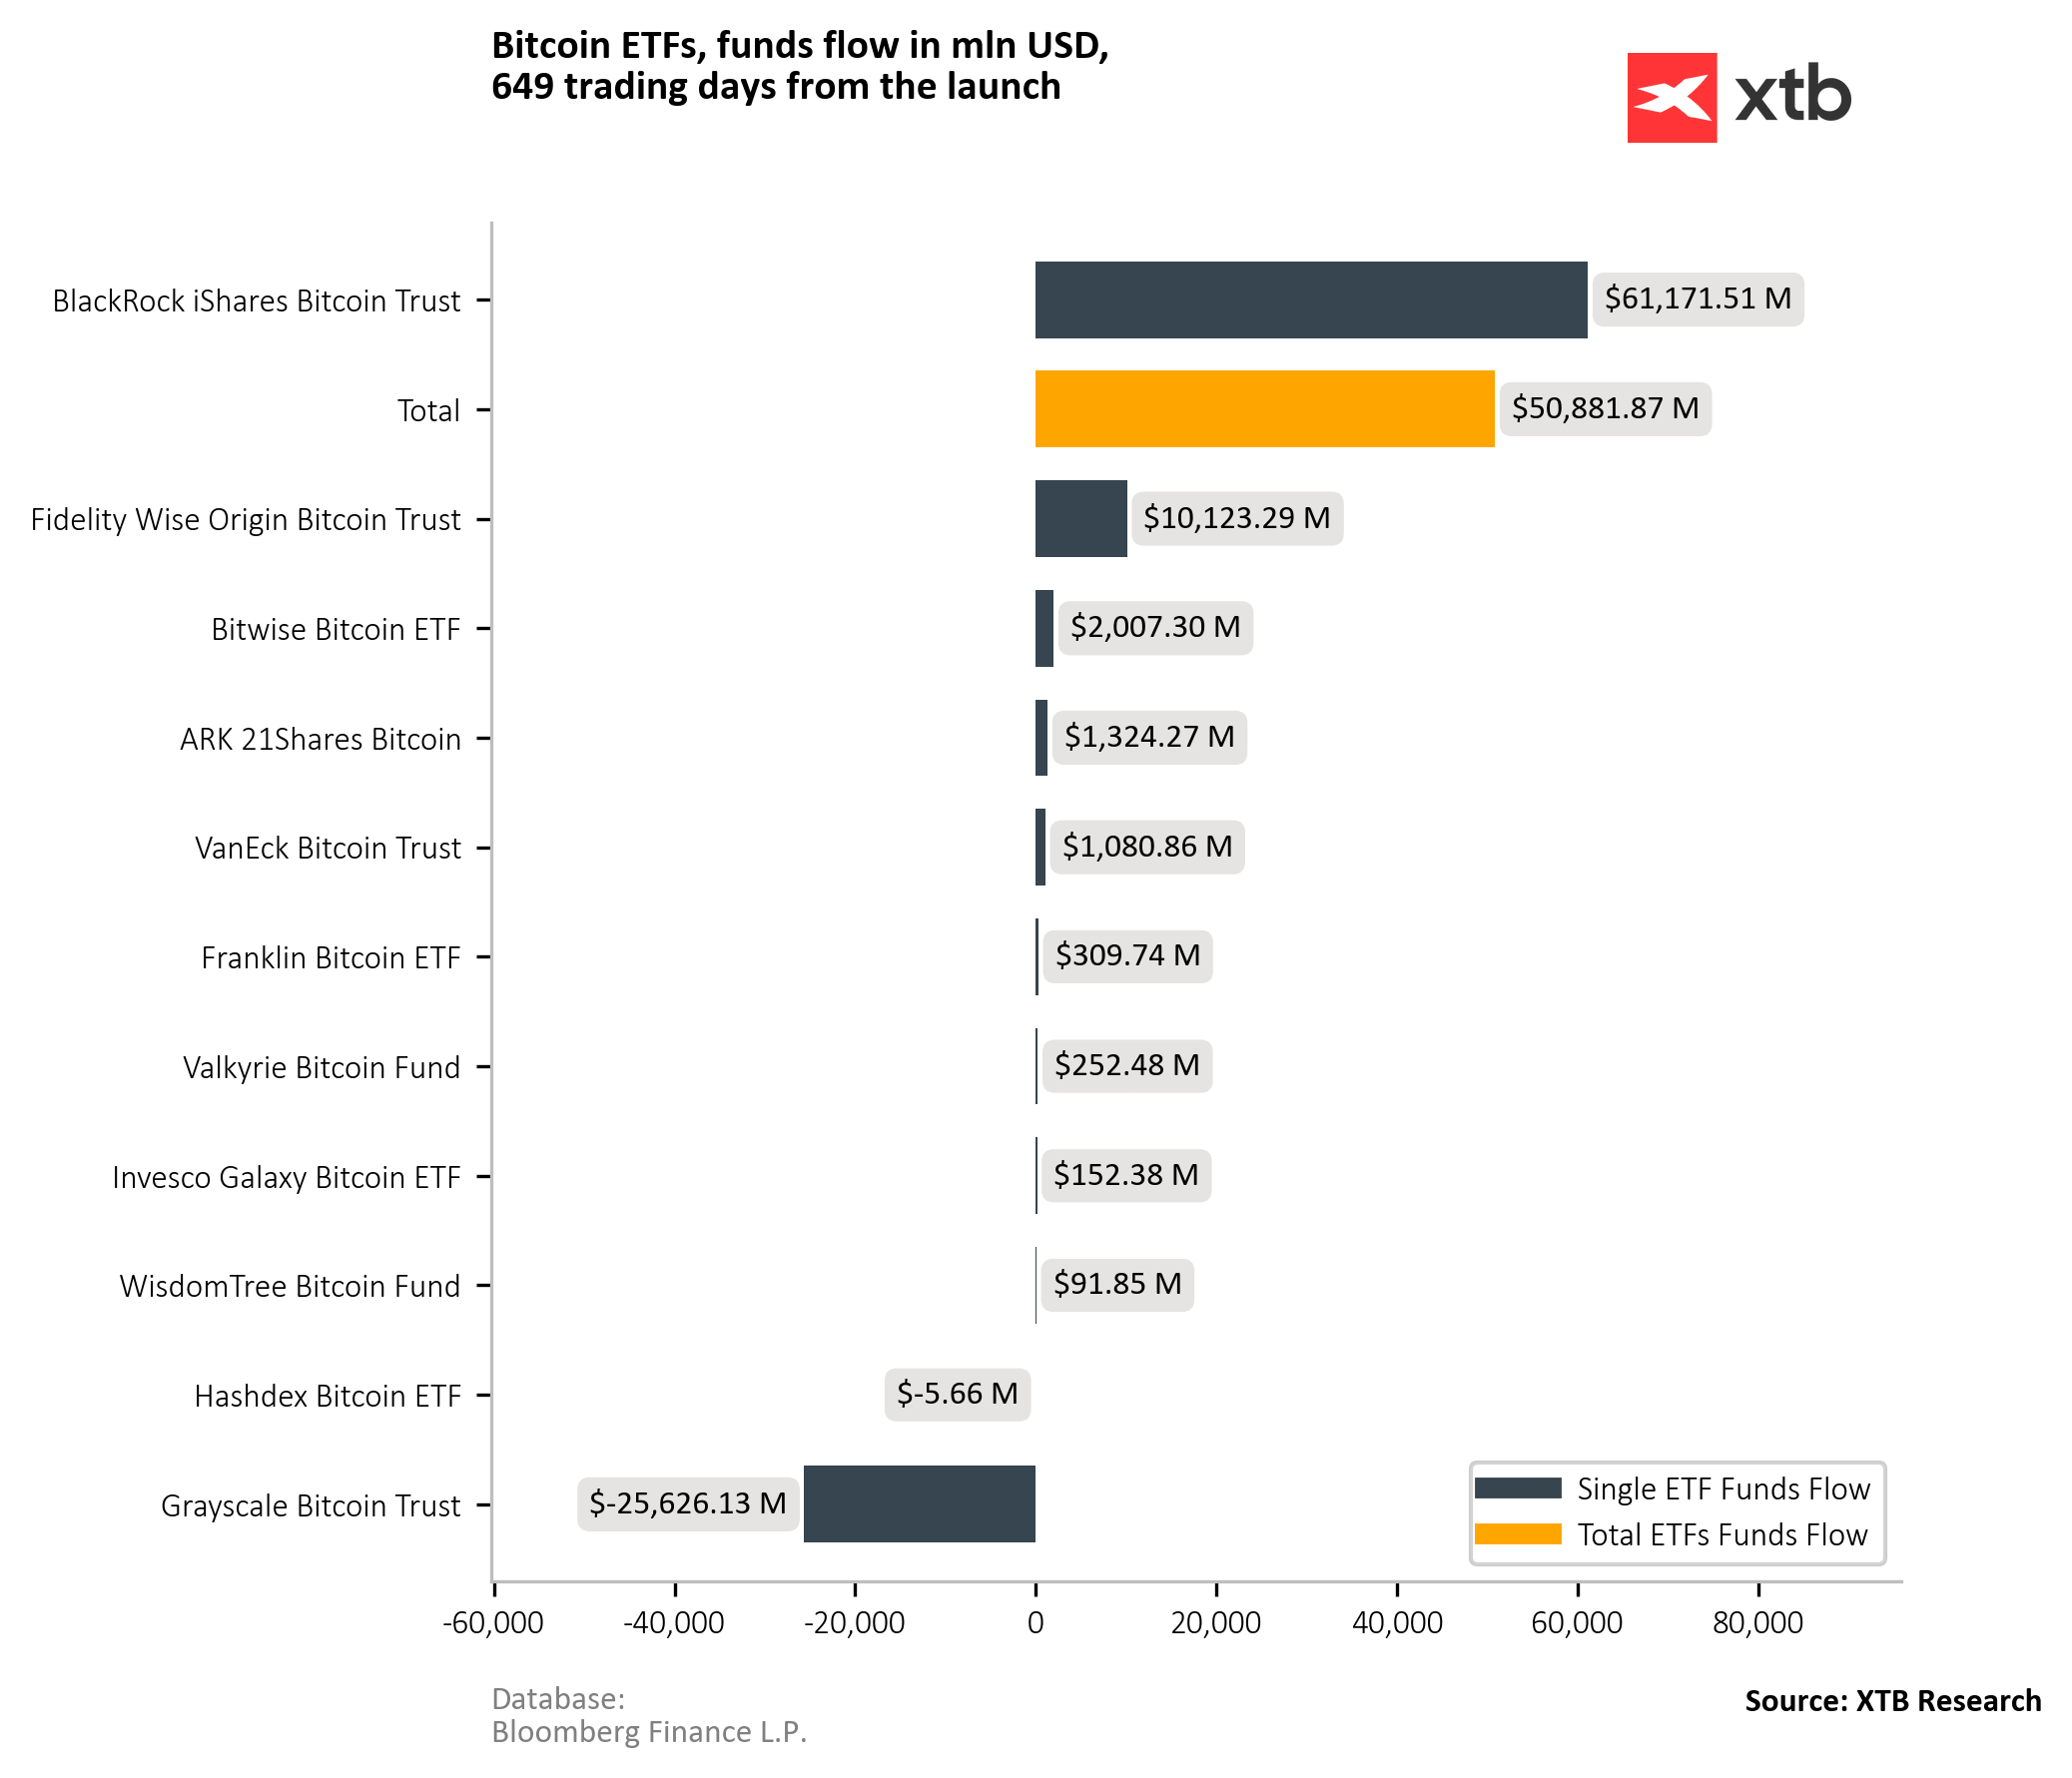
After 649 sessions since the launch of U.S. spot Bitcoin ETFs, cumulative net flows remain impressive at approximately $50.9 billion, highlighting the scale of structural demand that has developed around the asset class. BlackRock’s iShares Bitcoin Trust is the clear leader, with inflows exceeding $61.2 billion, while Fidelity has attracted more than $10.1 billion, demonstrating the strong concentration of capital in the two largest products.
The main counterweight remains Grayscale Bitcoin Trust, which has recorded more than $25.6 billion in outflows — without this supply, the cumulative result for the entire segment would be significantly higher. Importantly, the group’s overall balance remains positive despite periods of heavy outflows in 2026, making it difficult to argue that Bitcoin’s long-term institutionalization trend has reversed. The key takeaway, however, is that the success of Bitcoin ETFs has been highly uneven: the market has clearly picked its winners, with BlackRock emerging as the dominant gateway for investors seeking regulated BTC exposure.
Source: XTB Research
Bitcoin ETFs compared with the largest traditional-market ETFs
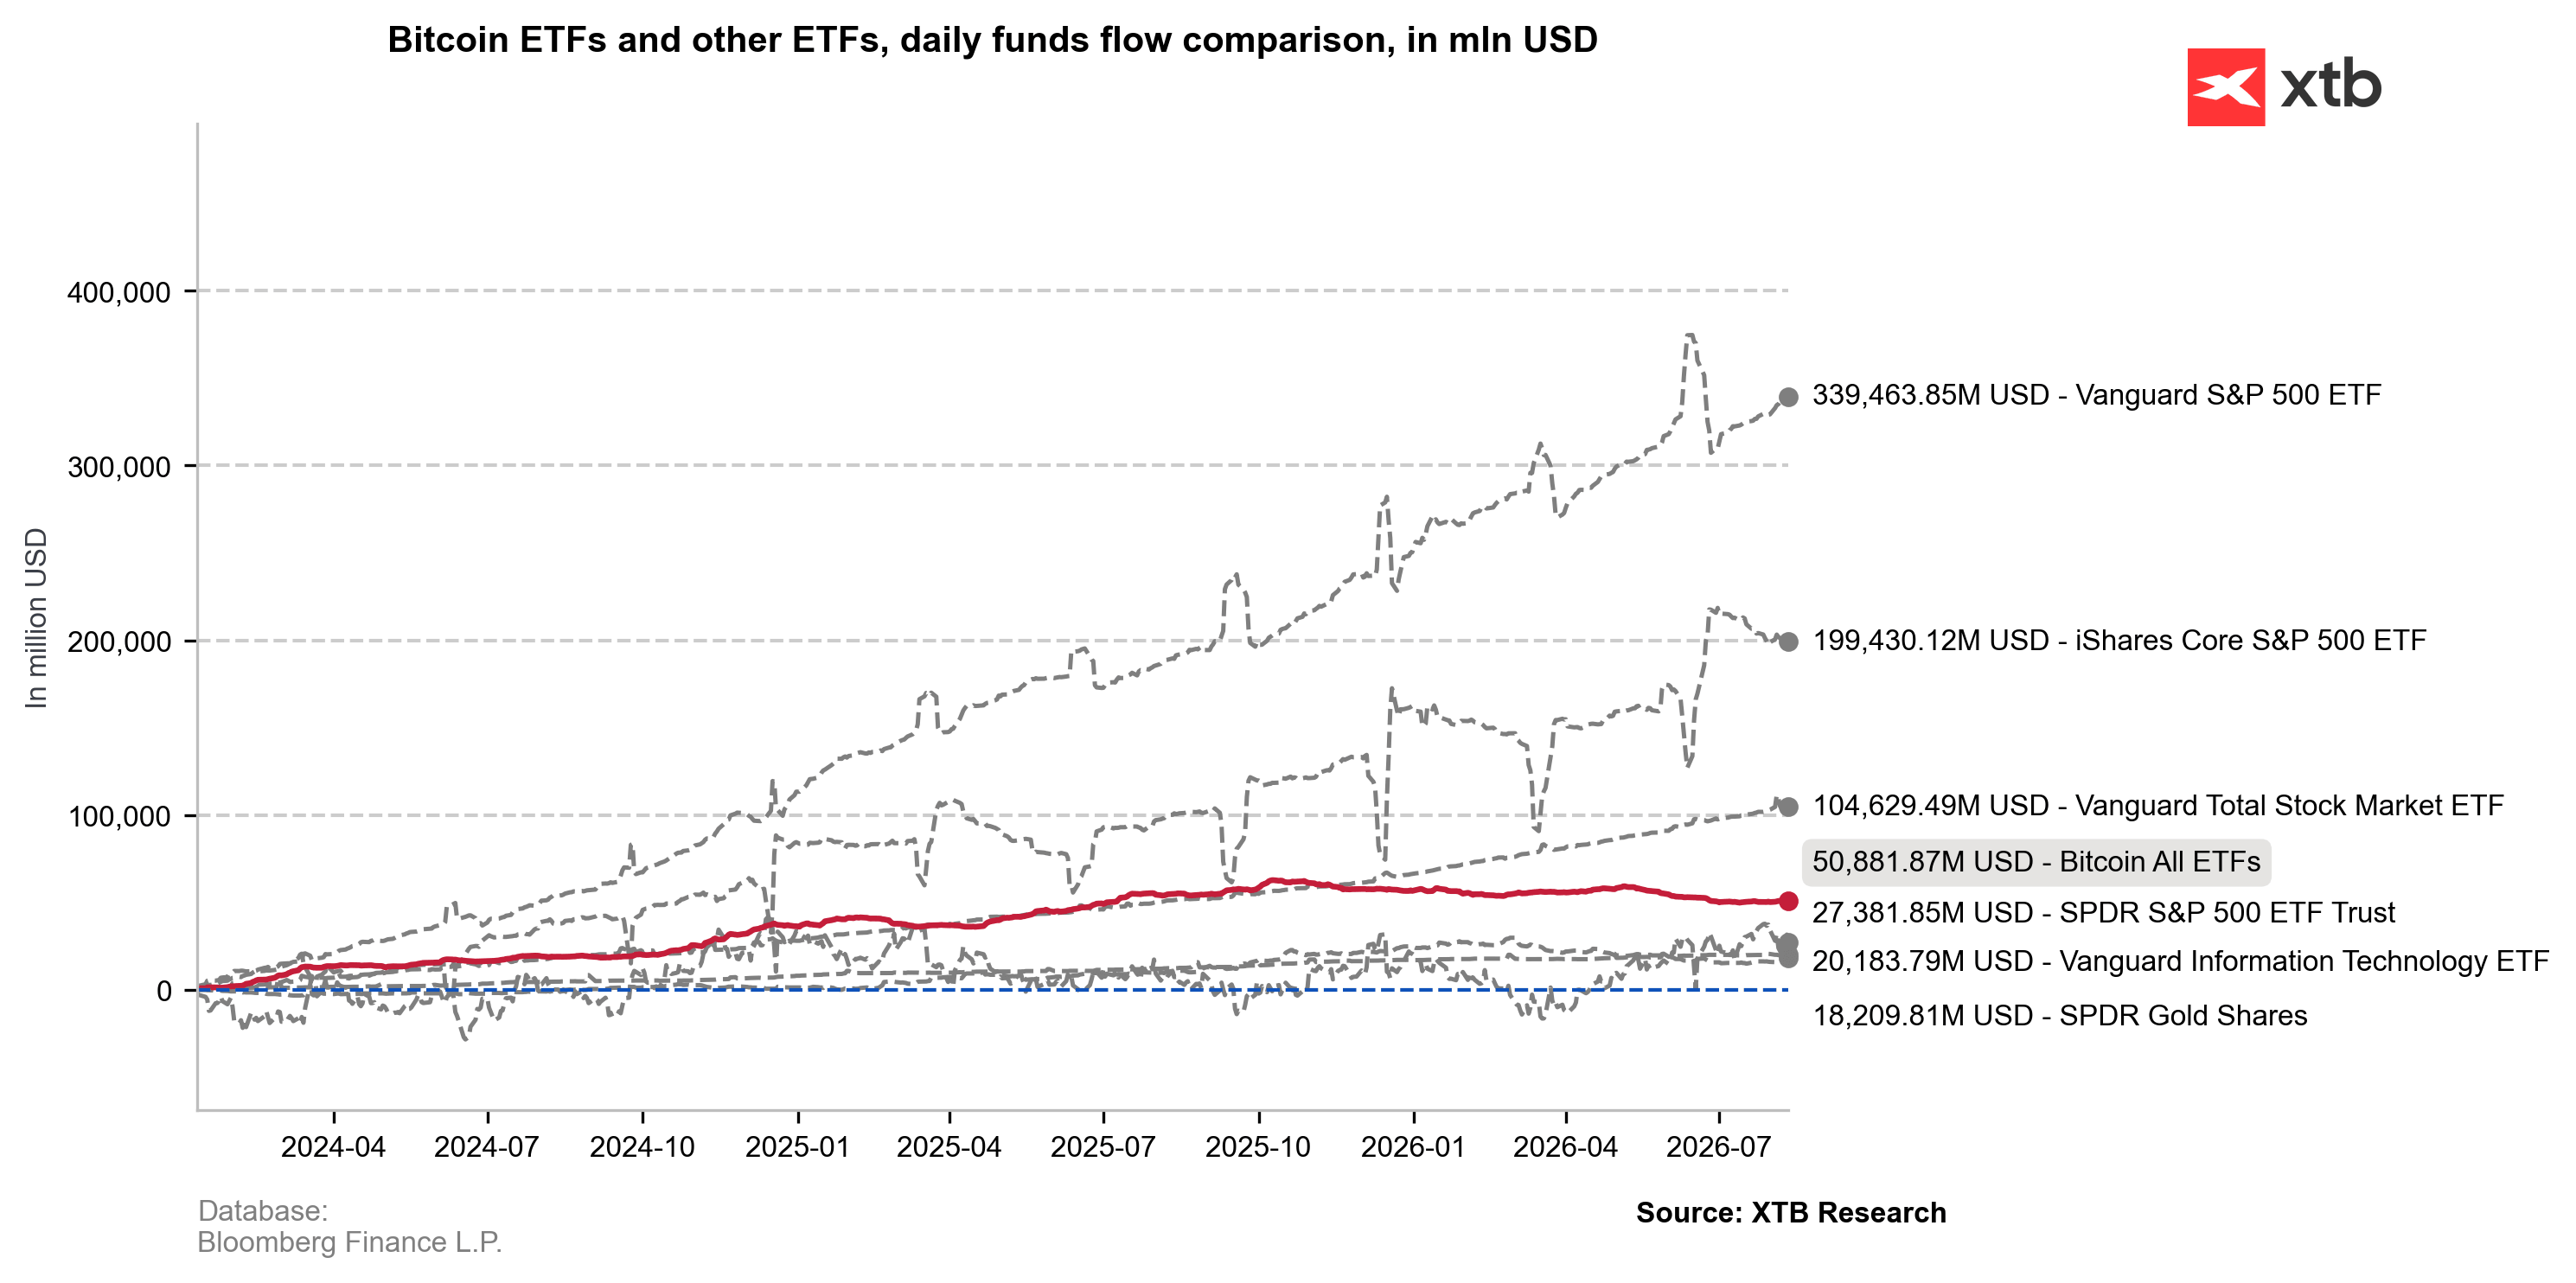
Cumulative inflows of approximately $50.9 billion put spot Bitcoin ETFs in an interesting position relative to some of the largest products in the traditional ETF market. Over a comparable period since launch, the Bitcoin ETF segment has already attracted more capital than the flows shown for SPDR S&P 500 ETF Trust, Vanguard Information Technology ETF and SPDR Gold Shares, although it still trails the largest Vanguard and iShares broad-equity funds.
Particularly notable is the speed at which Bitcoin has built this capital base — U.S. spot ETFs have only been operating since January 2024. The data confirm that spot Bitcoin ETFs have become one of the key bridges connecting crypto with the traditional asset-management industry, although the pace of inflows has clearly weakened in recent months. For Bitcoin, the most important point is therefore not simply the $50.9 billion figure, but the fact that BTC has built an investment product capable of competing for capital with some of the world’s largest and most recognizable ETFs in such a short period.
Source: XTB Research
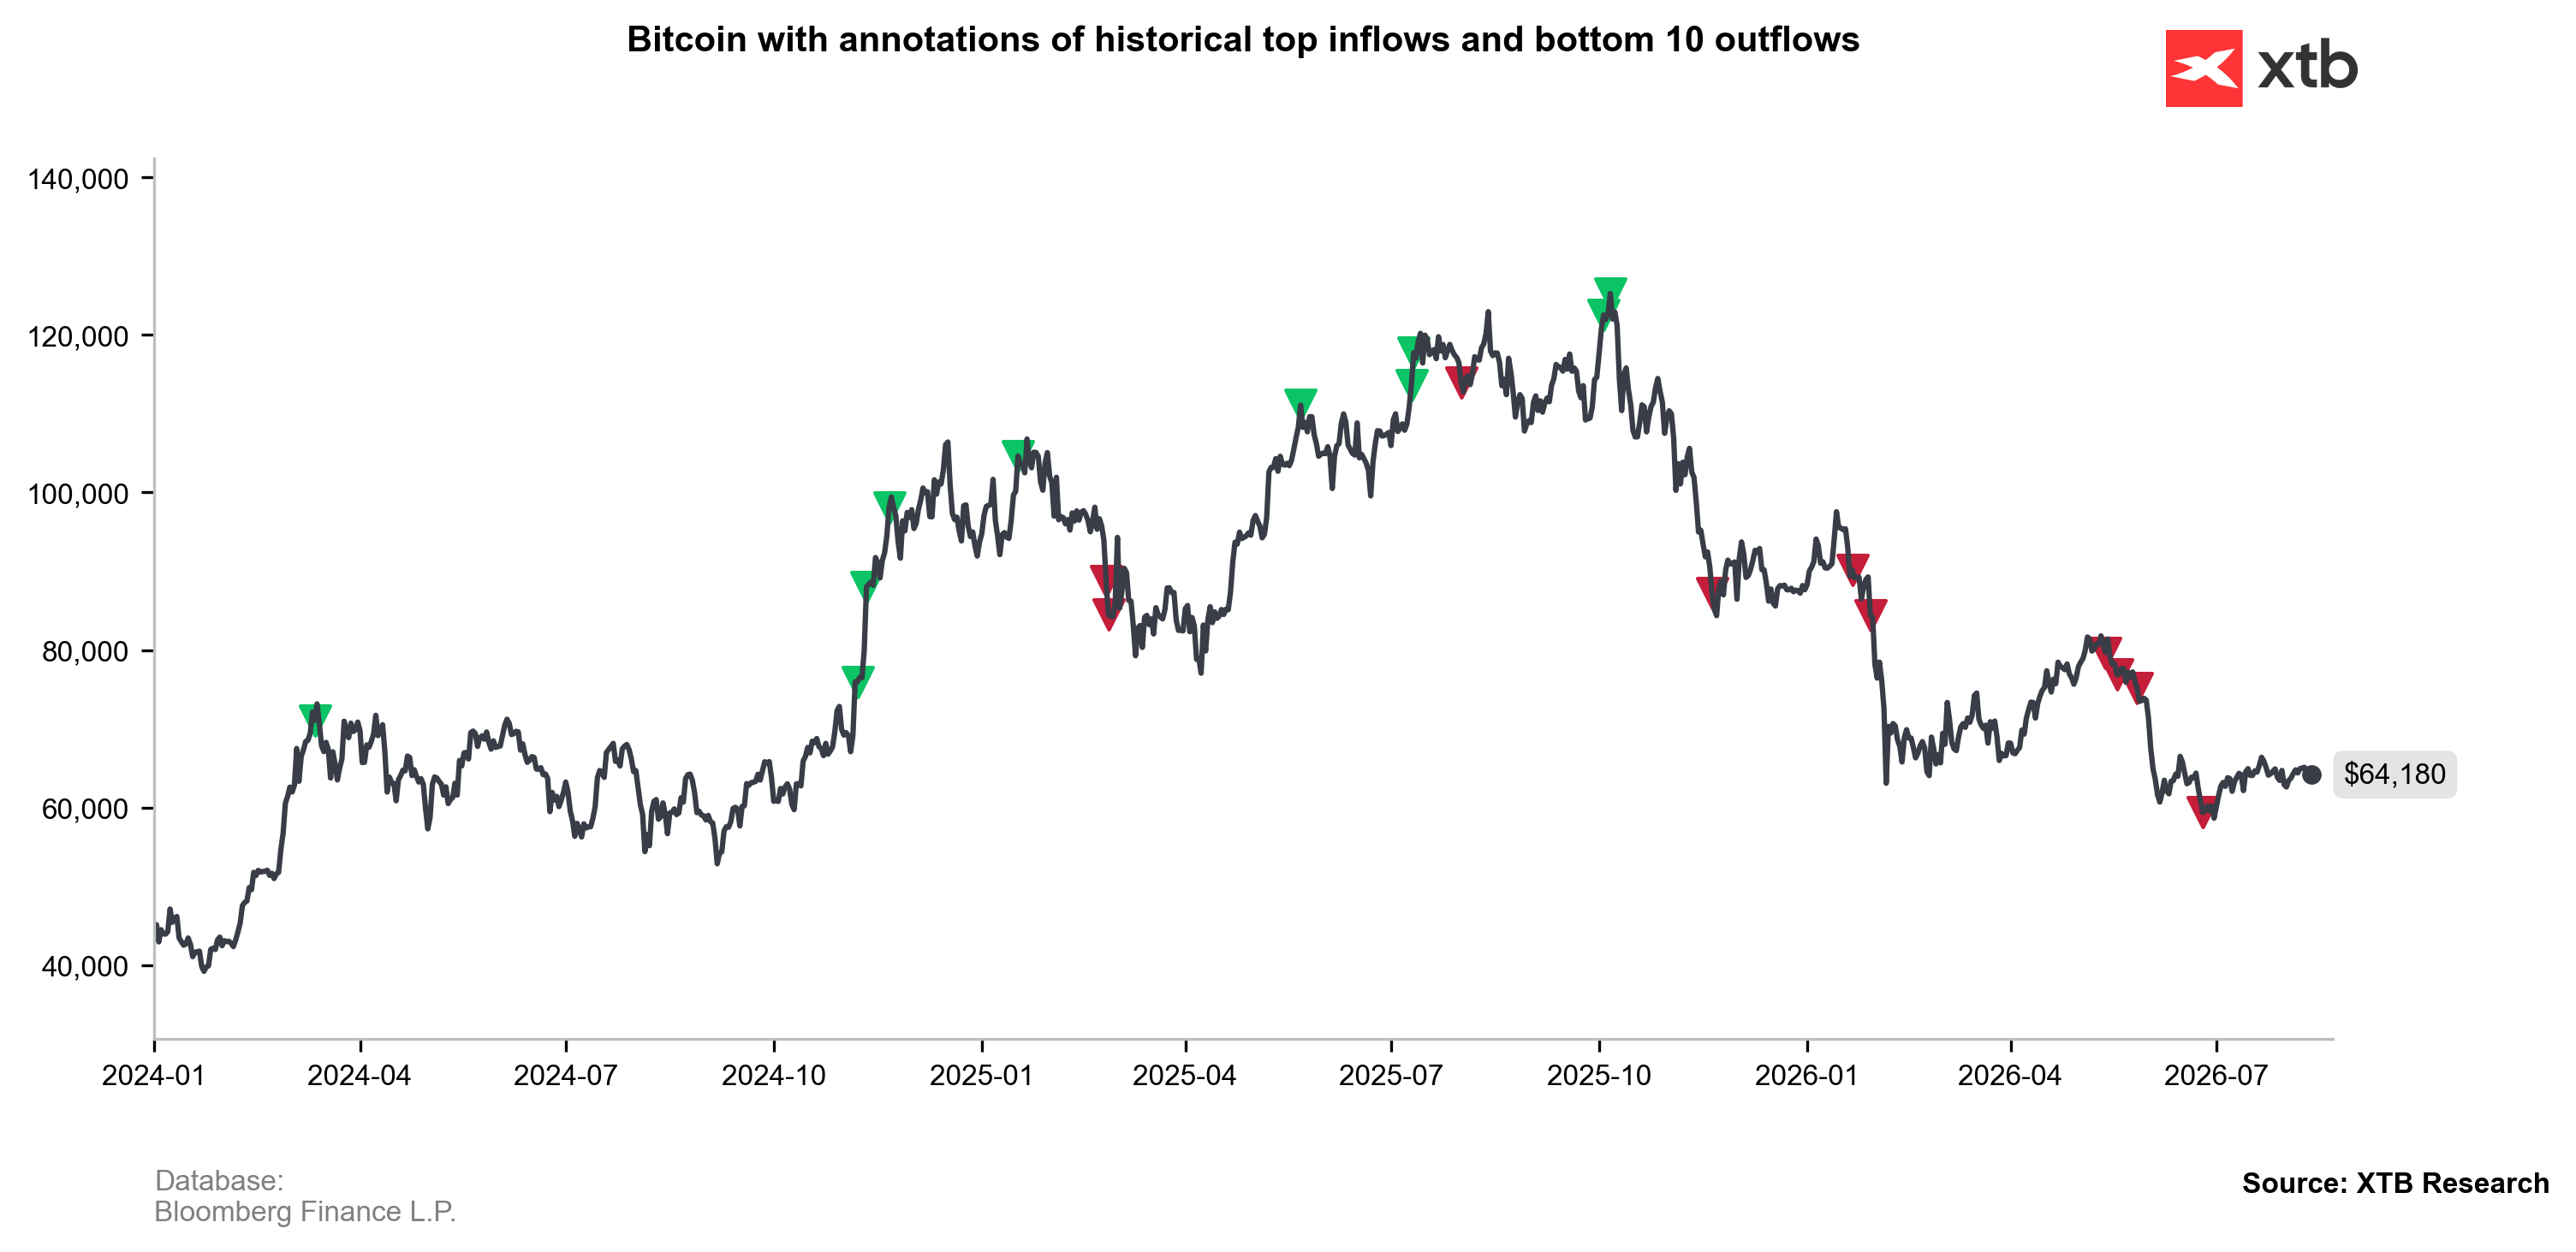
Largest ETF inflows and outflows versus Bitcoin’s price
Comparing extreme ETF flows with Bitcoin’s price shows that ETFs are an important part of the market structure, but they should certainly not be treated as a simple buy or sell indicator. The largest historical inflows have often occurred near local peaks or during mature stages of bullish impulses, when rising prices attracted additional capital rather than initiating a new rally.
The same mechanism works in reverse: the largest outflows often appear after substantial declines, when investors reduce exposure in response to deteriorating momentum. This is an important observation because it suggests that ETF flows are partly reactive and can amplify an existing trend rather than anticipate it.
With Bitcoin trading around $64,200, the key signal would therefore not be a single strong inflow session, but sustained positive flows over several consecutive weeks. Only such a change would provide stronger evidence of a more durable return of institutional demand.
Source: XTB Research
Eryk Szmyd XTB Financial Markets Analyst


Oil gains as U.S. crude inventories fall


U.S. indices attempt to rebound after recent losses


Hot inflation data from the US🔥📈 PPI and retail sales are rising!


Nickel market panic 🚩 INSG revises forecast, surplus in 2027?