
Bitcoin hovers around $115,000, holding on to recent gains as the week begins. The sentiment weakened slightly after Nasdaq and S&P 500 futures dipped on reports of an antitrust investigation into Nvidia. Ethereum is down more than 2.5%, falling to $4,500.
-
The U.S. dollar is weakening, but this has not translated into crypto gains on Monday.
-
The Fed is almost certain to cut rates by 25 bps on Wednesday.
-
Crypto sentiment remains highly sensitive to movements in equity indices.
On the optimistic side, if the U.S. bull market continues and gold prices keep rising (alongside falling bond yields and Fed rate cuts), there is a strong chance that Bitcoin could head toward new all-time highs later this year. However, U.S. equities are already heavily “overbought,” and the market may reassess sentiment while awaiting signals from the Fed and upcoming U.S. data. These could still suggest that labor market challenges may not be “quickly eased by rate cuts,” raising the risk of recession — a scenario that would almost certainly weigh negatively on Bitcoin as well as Wall Street.
Bitcoin ETF inflows accelerate
Last week saw a clear acceleration in net inflows into Bitcoin ETFs, driven by Wall Street optimism, a weaker dollar, and rising expectations of Fed rate cuts. The Federal Reserve is almost certain to cut rates on Wednesday, but historical patterns provide no guarantee that such a decision will translate into short-term gains in equity indices. Theoretically, a bull run on gold should support Bitcoin in medium term, as the BTC price lags gold in approximately 3-months.
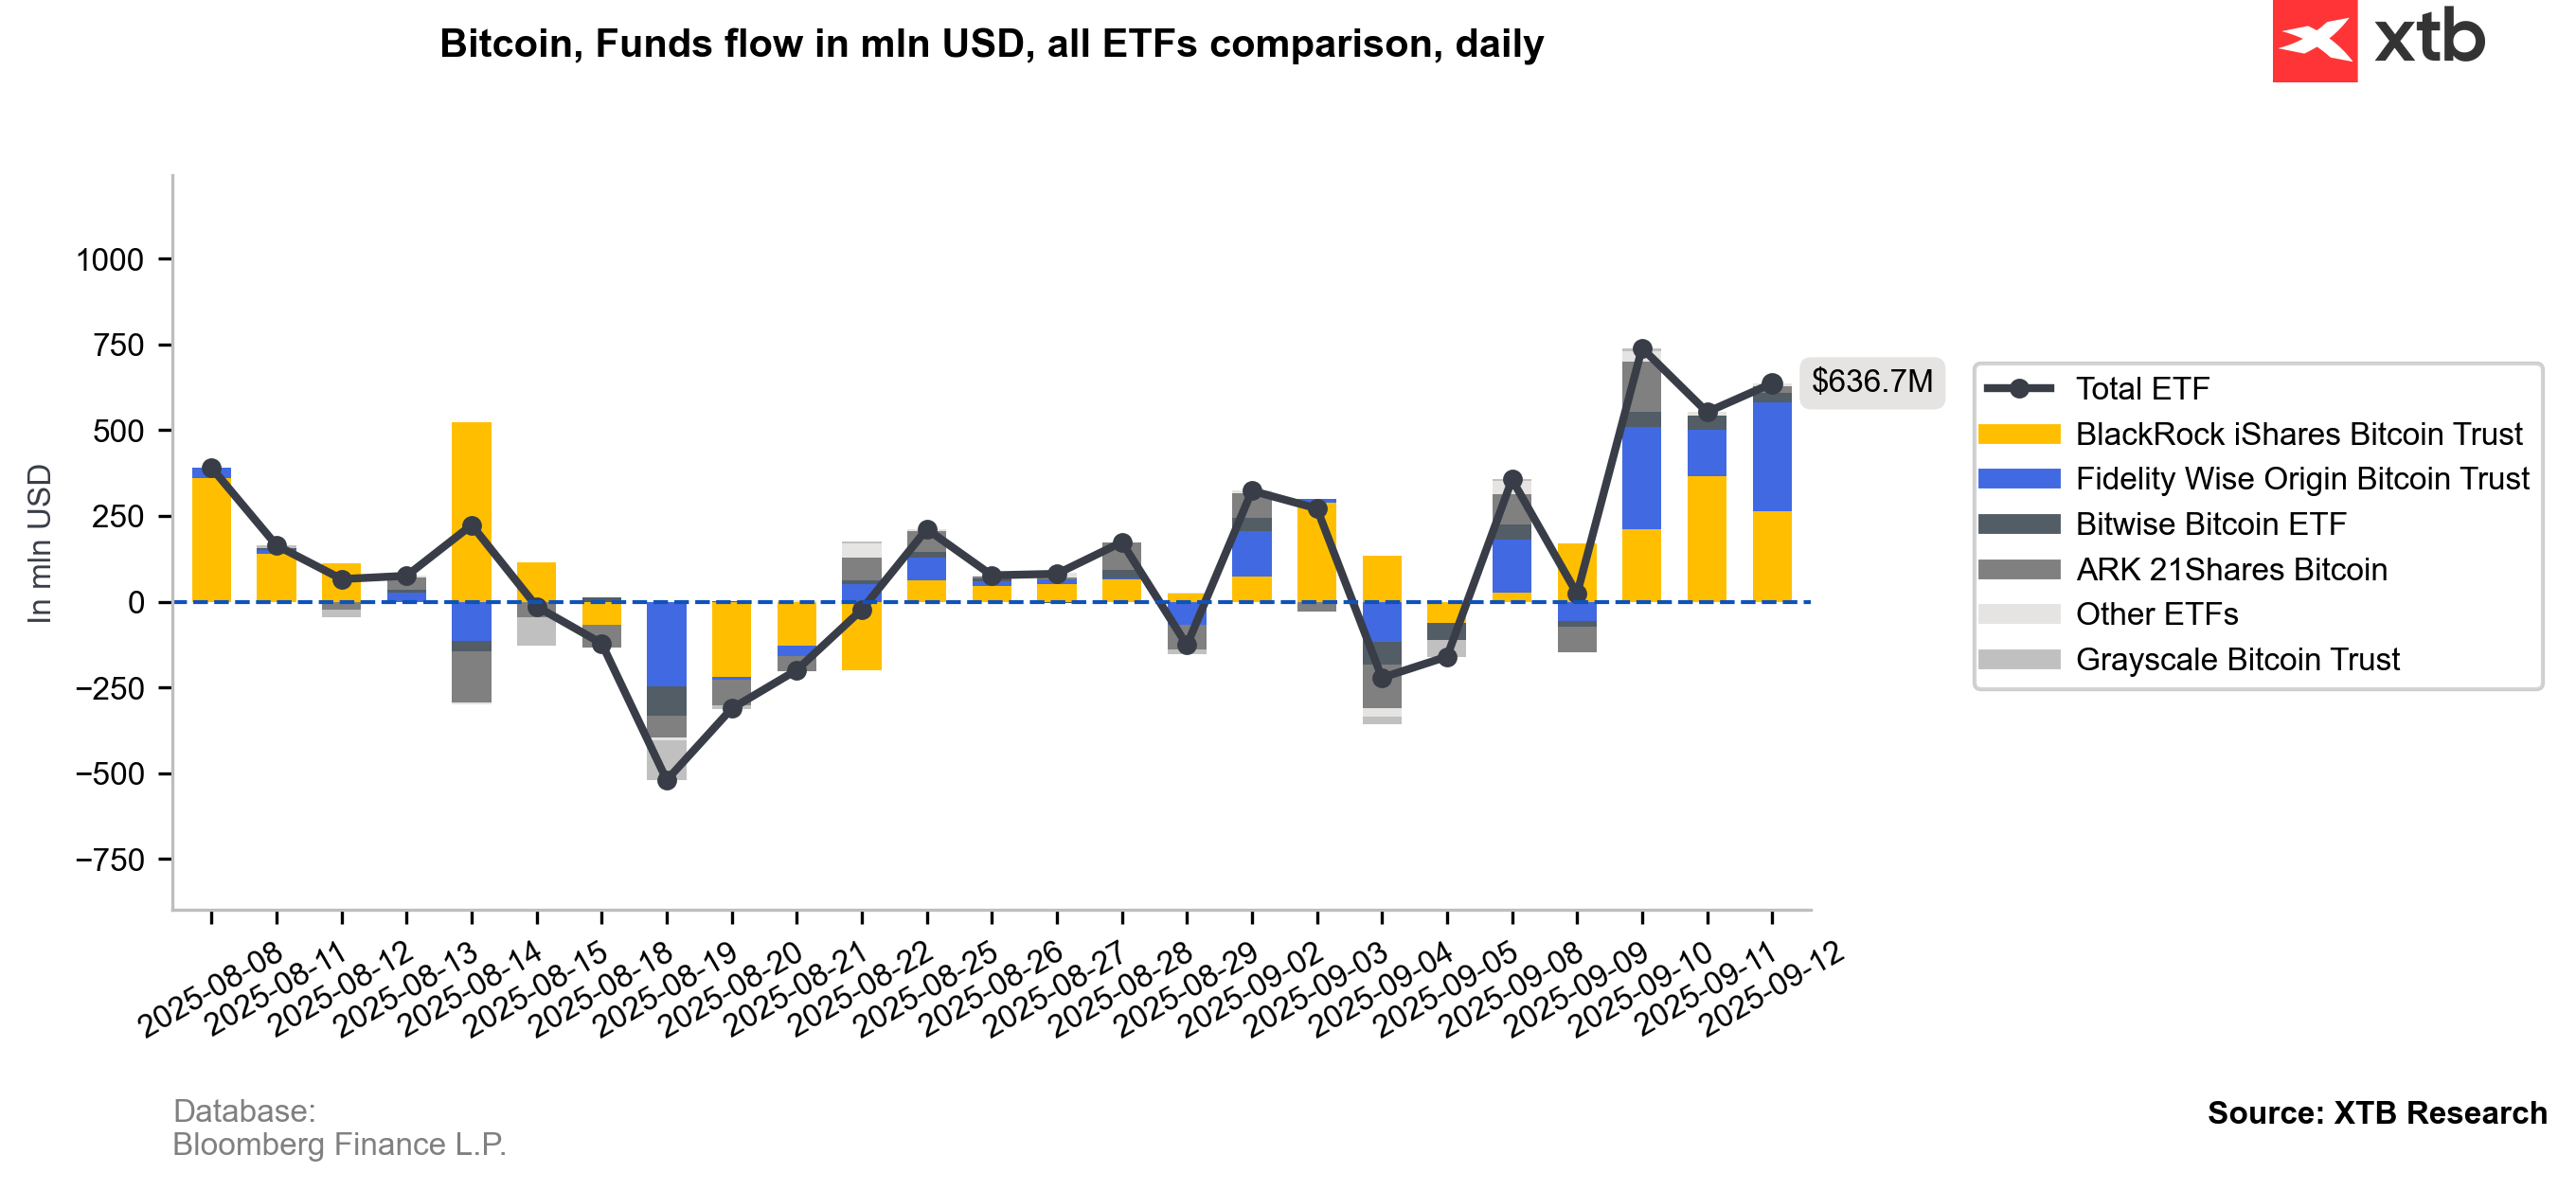
Source: XTB Research, Bloomberg Finance L.P.
On the other hand, on Friday we saw net outflows from ETFs on Ethereum.
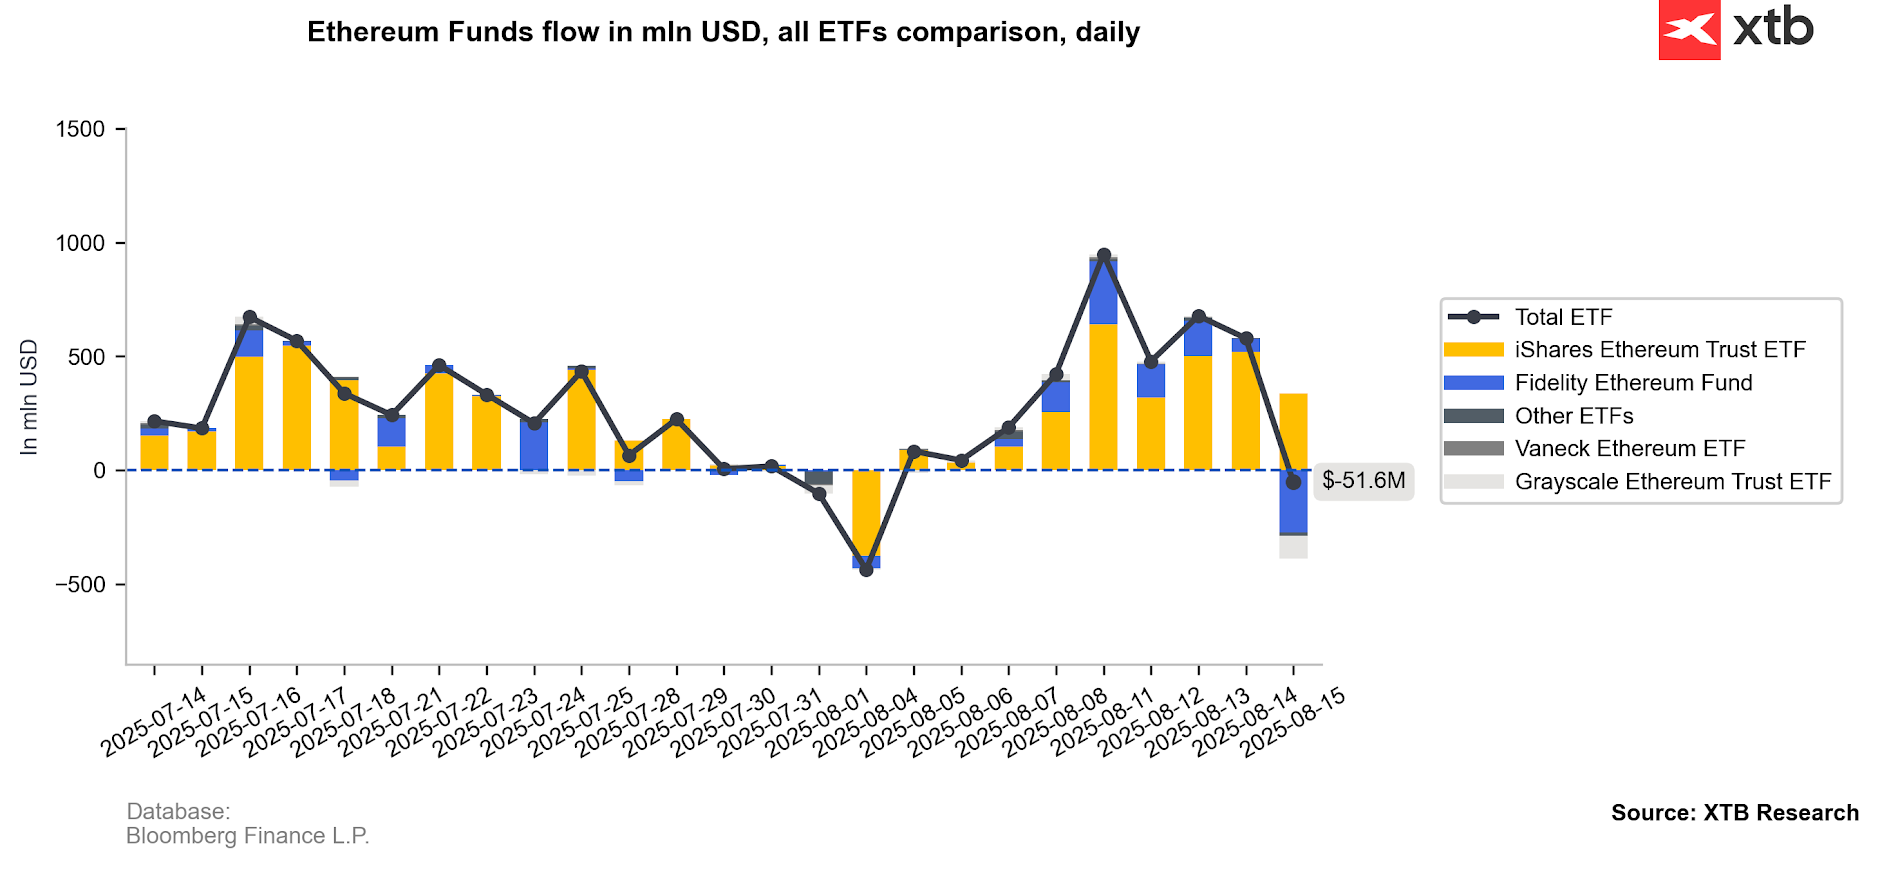
Source: XTB Research, Bloomberg Finance L.P.
Bitcoin & Ethereum Charts (D1 interval)
Bitcoin is fighting to stay above its 50-day exponential moving average (EMA50, orange line) near $114,500. If momentum holds, a move above $120,000 remains possible. On the downside, a break below EMA50 would likely open the way to a test of $108,000 and the 200-day EMA.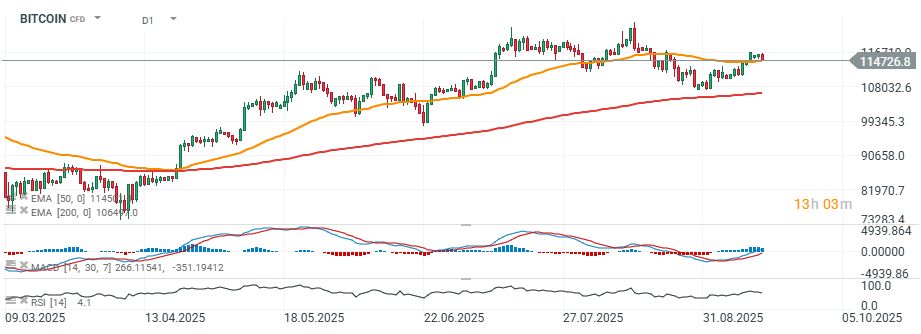
Source: xStation5
The technical outlook for Ethereum is also mixed. If selling pressure accelerates from current levels, a drop toward $4,100 (neckline) would likely confirm a bearish head-and-shoulders (H&S) pattern breakout.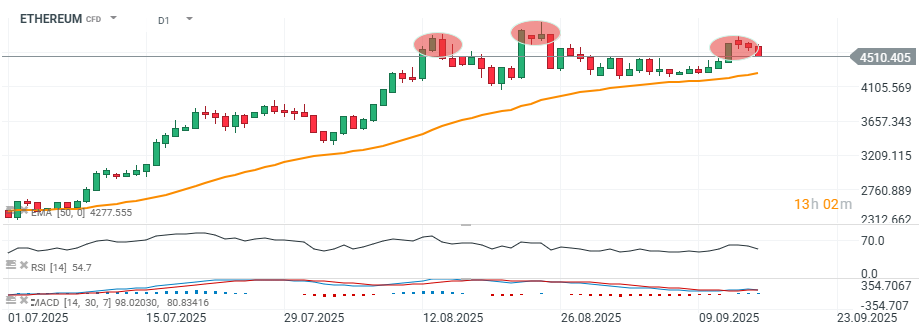
Source: xStation5

Eurozone PMIs: German Factory Revival Masks Underlying Stagnation 🇪🇺

Wall Street rebounds as Q2 earnings season significantly exceeds investors expectations

Daily Summary: Wall Street Regains Ground; Another Intervention in the Yen Market❓

Three Markets to Watch Next Week (July 31, 2026)