
The pair EUR / USD attempts to break above the resistance level at 1.21 but is still struggling. Last week was marked by strong gains in the euro against the US dollar and the recovery extended to the resistance zone marked by 1.21.
In addition to this resistance level, we can see that the price has approached the downtrend line, which pushes the price down.
However, we can see that the EMA 24 and 50 (orange and blue line) crossed on the daily time frame chart which suggests that the rally is not over yet.
At this moment, even if the price is correcting slightly downward, as long as it remains above the 1.2 mark, the bullish scenario remains valid.
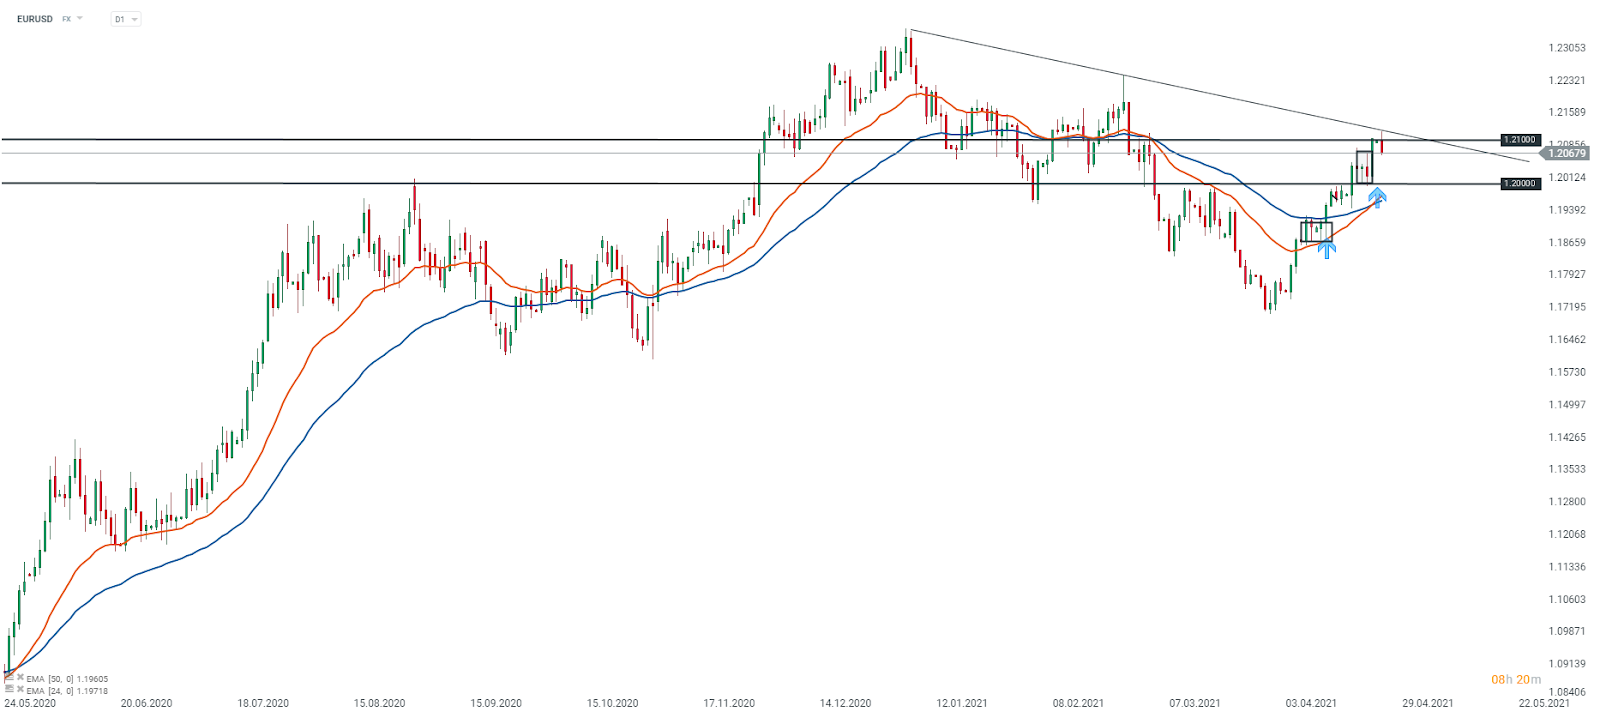
Eur/usd, Daily (D1) time frame chart. Source: xStation 5
Taking a look at the US dollar index (USDIDX), we can see that the price remains under pressure and the bearish momentum continues after the breakout of the rising wedge in the 15 mins time frame chart.
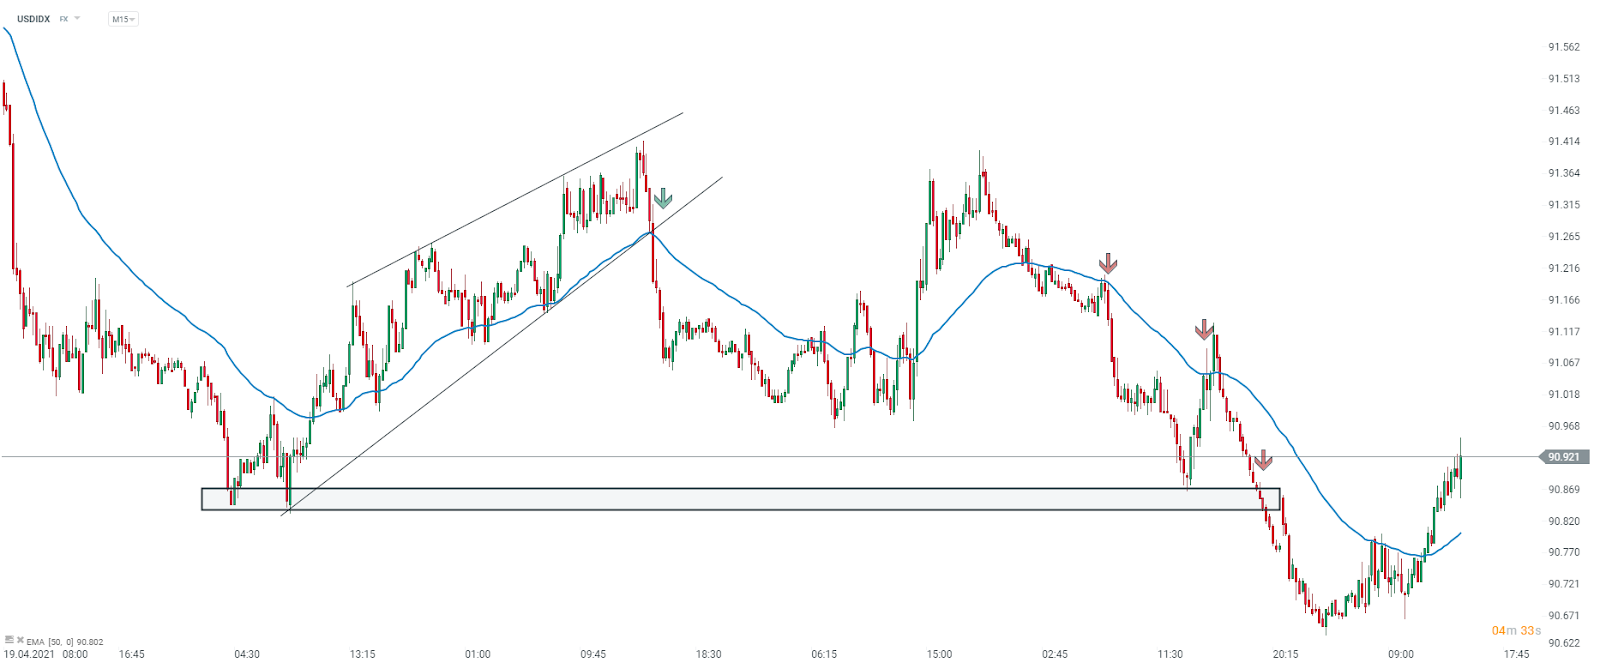
USDIDX, 15 minutes (15m) time frame chart. Source: xStation 5
NZD is the best performing major currencies while JPY and CHF lag the most
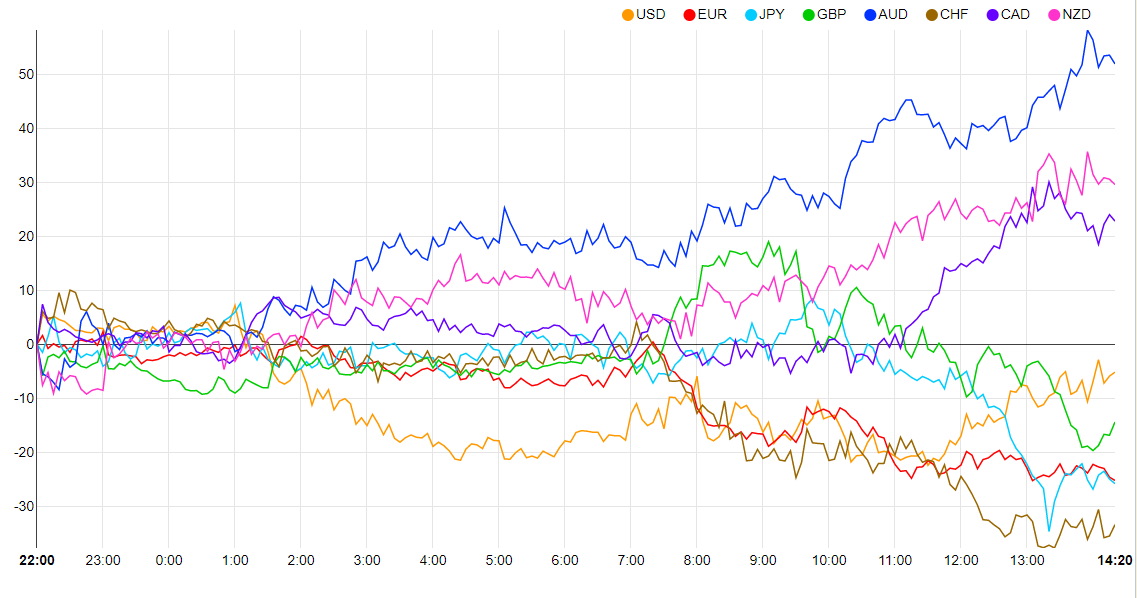
Source: currency-strength.com
Henrique Tomé, XTB Portugal

Daily Summary - The market starts to doubt rate hikes after Warsh, but Trump destroys the rebound

Not so hawkish words, dovish dodges. EURUSD at 1.1450 during Kevin Warsh's Q&A
BREAKING: Fed Keeps Rates Unchanged Amid Regional Dissents and Warsh's Pause
🟡Gold tests $4000 ahead of the Fed decision