
Today's session marks the new trading week but also the new month. During the month of April the U.S dollar (USD) recorded the worst performance throughout this year. The DXY index has dropped more than 2%.
If we look at the 4 hours time frame chart on EUR/USD, we can see that the euro has been maintaining the bullish momentum while the u.s dollar continues to lose strength.
Despite the bearish pressures at the end of last week, today's session is once again highlighted by the strength of the euro against the USD.
As the US dollar continues to depreciate, the euro regains ground, even after breaking below the upside trendline.
The next short-term obstacle will be the 50 period EMA (blue line). If we see a clear break above that, then the bullish momentum may extend towards the key level (1.21).
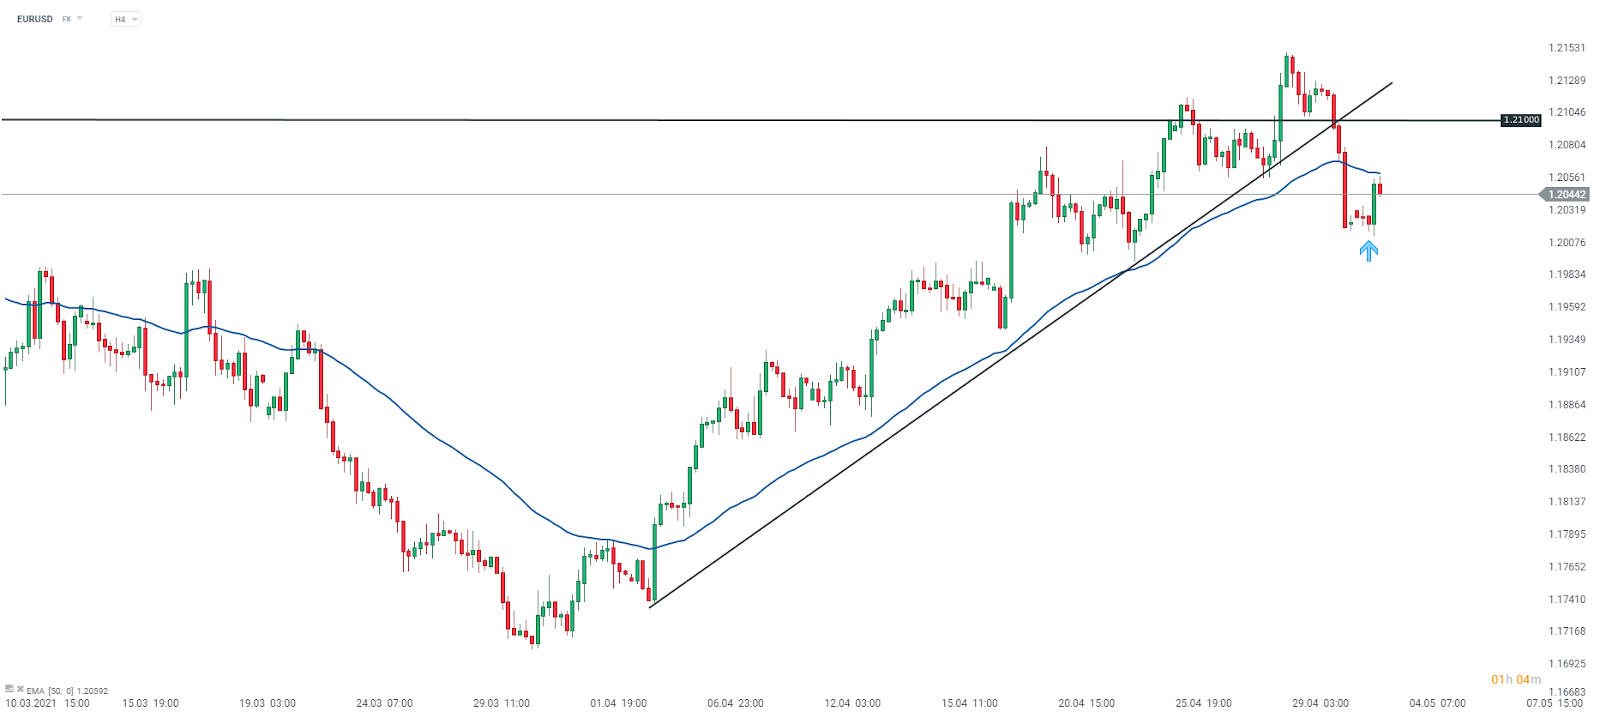
Eur/usd, 4 hours time frame chart. Source: xStation 5
Taking a look at the US dollar index (USDIDX), we can see that the month of April (the rectangle) was very negative for the USD. The last 2 sessions were positive for the USD, after the price tested the upside trendline. However, the bearish pressures remain todays.
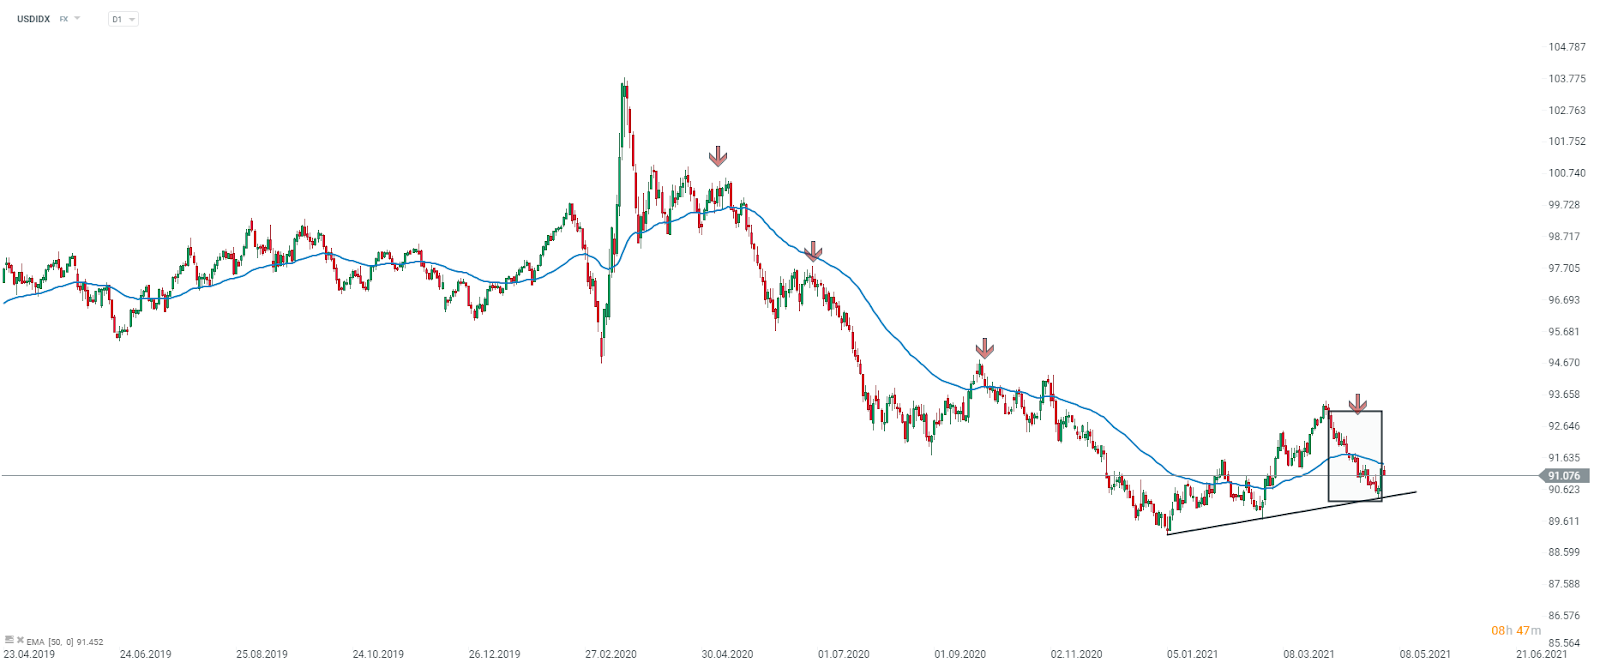
USDIDX, Daily (D1) time frame chart. Source: xStation 5
GBP is the best performing major currencies while CHF lag the most
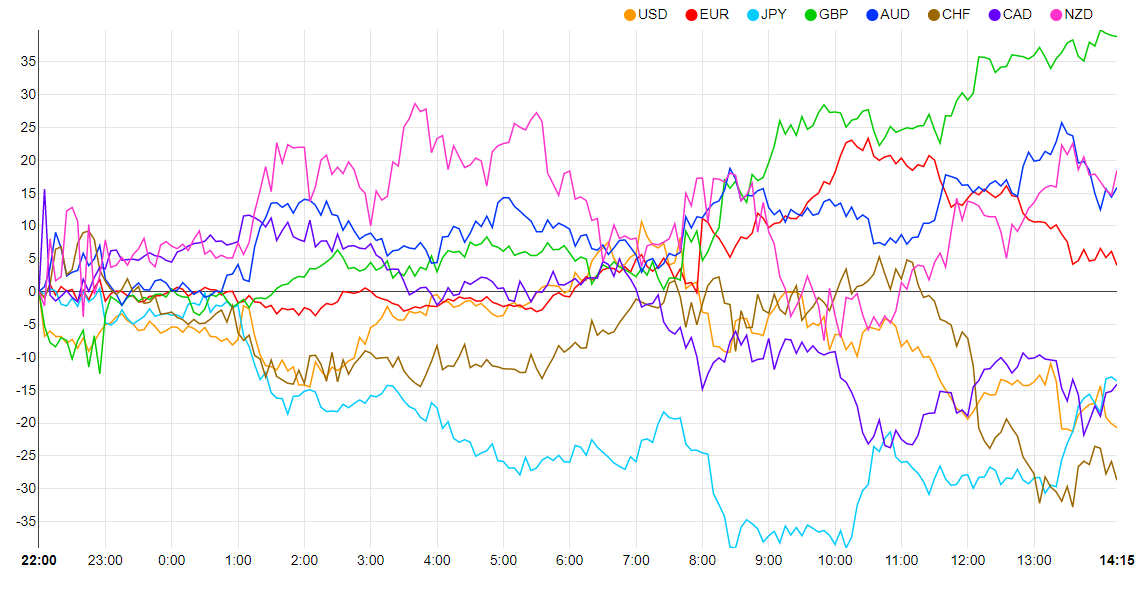
Source: currency-strength.com
Henrique Tomé, XTB Portugal

Economic Calendar: Time for Tesla and Google Earnings (22.07.2026)

Morning Wrap: AI companies and gold back in favour? (22.07.2026)

Daily Summary: Semiconductors Rise in the Shadow of Geopolitical Turmoil

Market Wrap: Airlines Under Pressure, Europe Resists Expensive Oil