



The EUR/USD continues to decline after testing the 1.10179 area. Currently, the price is consolidating near an important zone, close to the 50-period EMA.
If the bears manage to break the zone marked by the EMA, the bearish movement could extend further. Additionally, there are several signs indicating that the US dollar may continue to strengthen against the euro.
Analyzing the USD chart with TNOTE, we see that the divergence has ended. When comparing the behavior of the USD with the VIX, there is a possibility that the VIX could spike again, which could also support a stronger dollar.
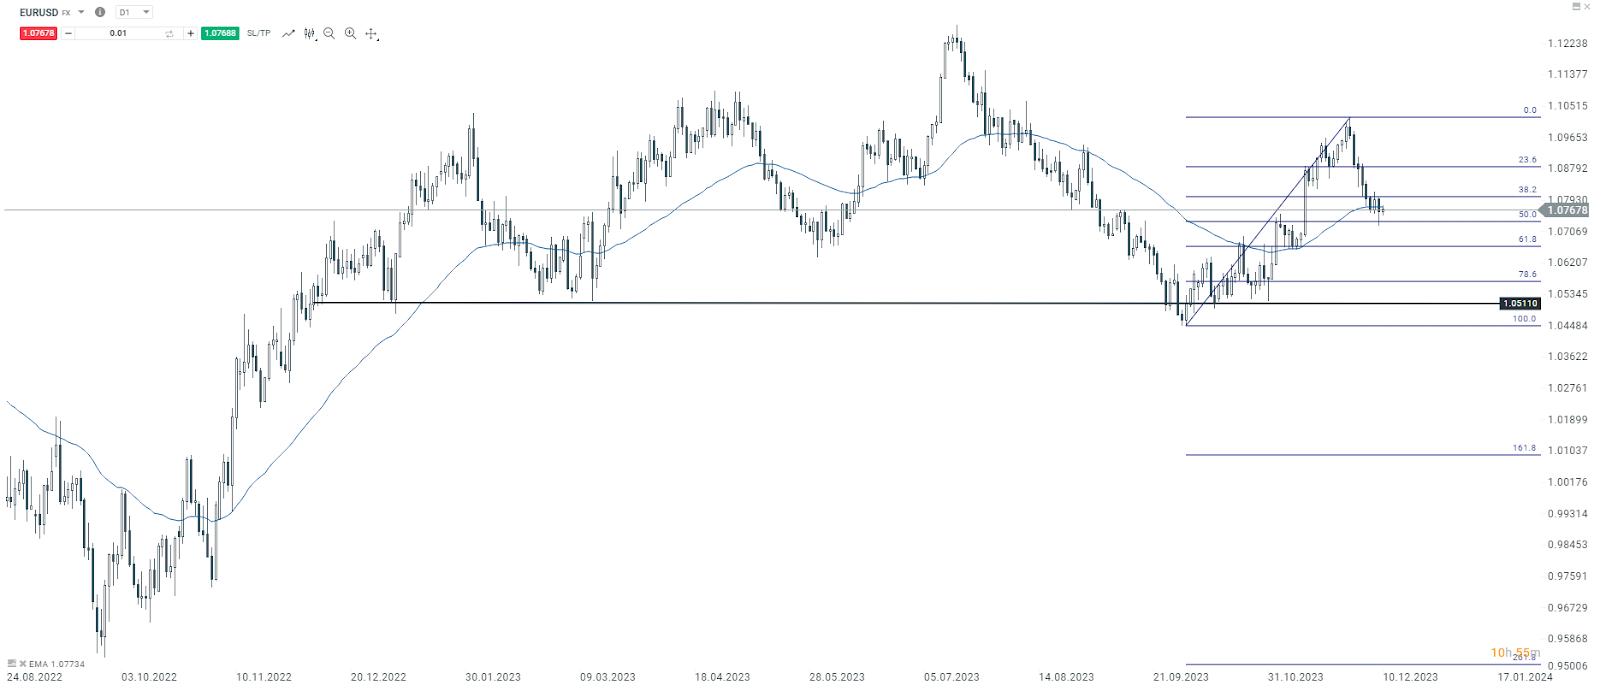
Daily time frame chart. Source: xStation 5
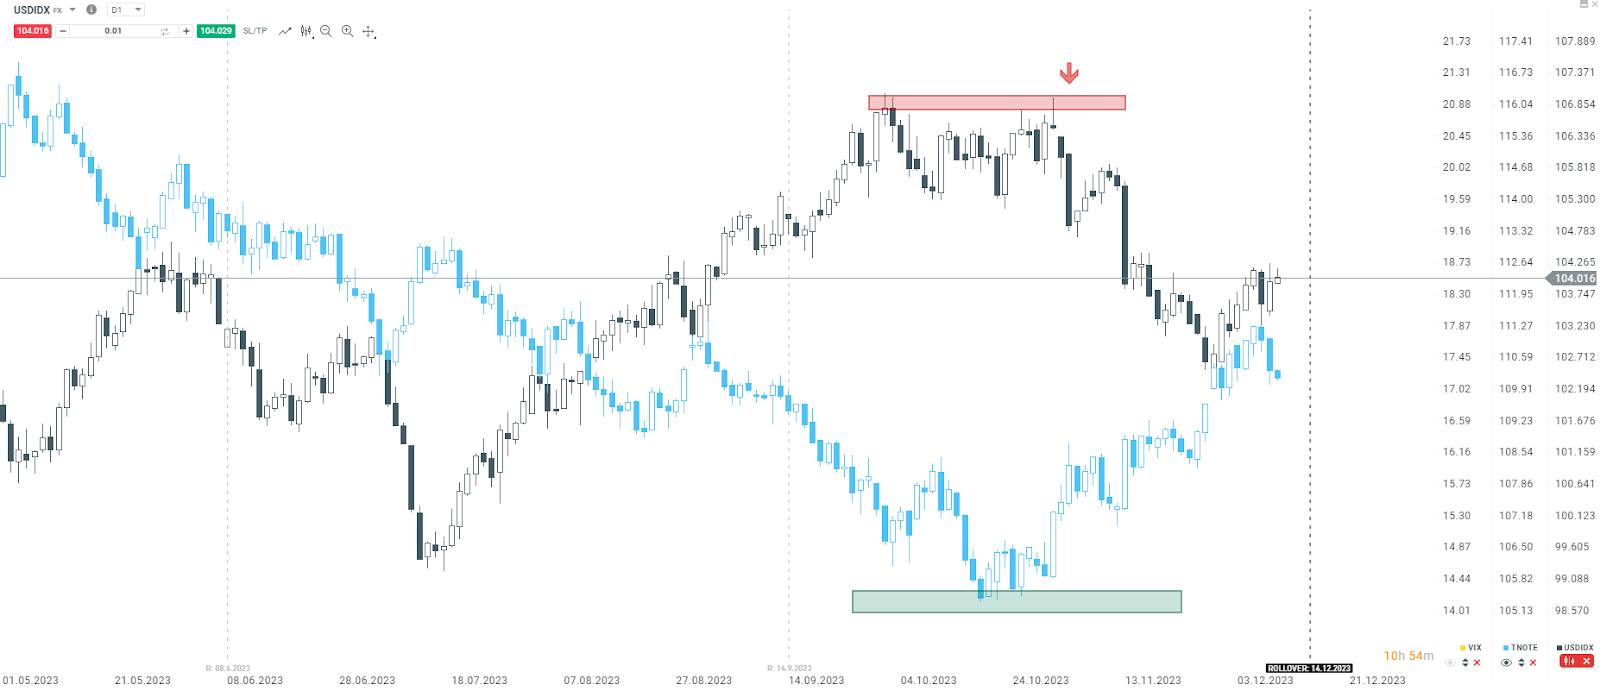
USD Index and TNOTES., Daily time frame chart. Source: xStation 5
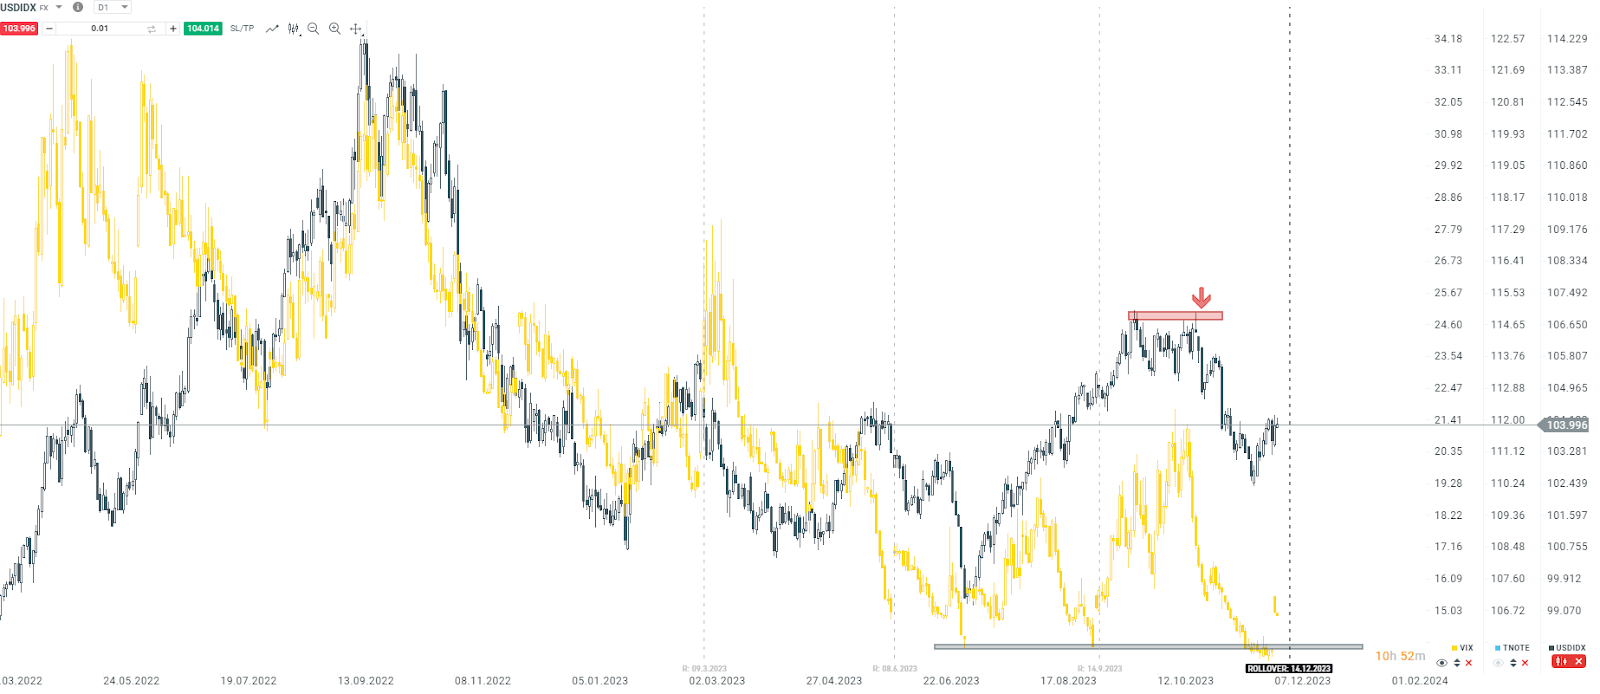
VIX and USD Index. Daily Time Frame Chart. Source: xStation 5
Henrique Tomé,
Analyst Portugal



Daily Summary: Friday offers no relief; the US100 drops 2%🚨


Three Markets to Watch Next Week (October 16, 2026)

🔼 EURUSD continues to rebound


Chart of the Day: NATGAS - Are there chances for a seasonal rebound amid warm weather?