



The possibility of earlier-than-anticipated interest rate cuts in the Eurozone, along with the recent sell-off in indices, is exerting pressure on the EUR/USD pair.
Since sellers managed to break through the support zone defined at 1.072, the downward trend has intensified further.
However, recently there has been some indecision in the EUR/USD, with the price fluctuating within the range of 1.06 to 1.068.
On the 4-hour chart, it can be observed that the price is forming a channel pattern. If sellers succeed in breaking the lower boundary of the channel, then a new downward movement towards the next support zone at 1.055 should not be ruled out
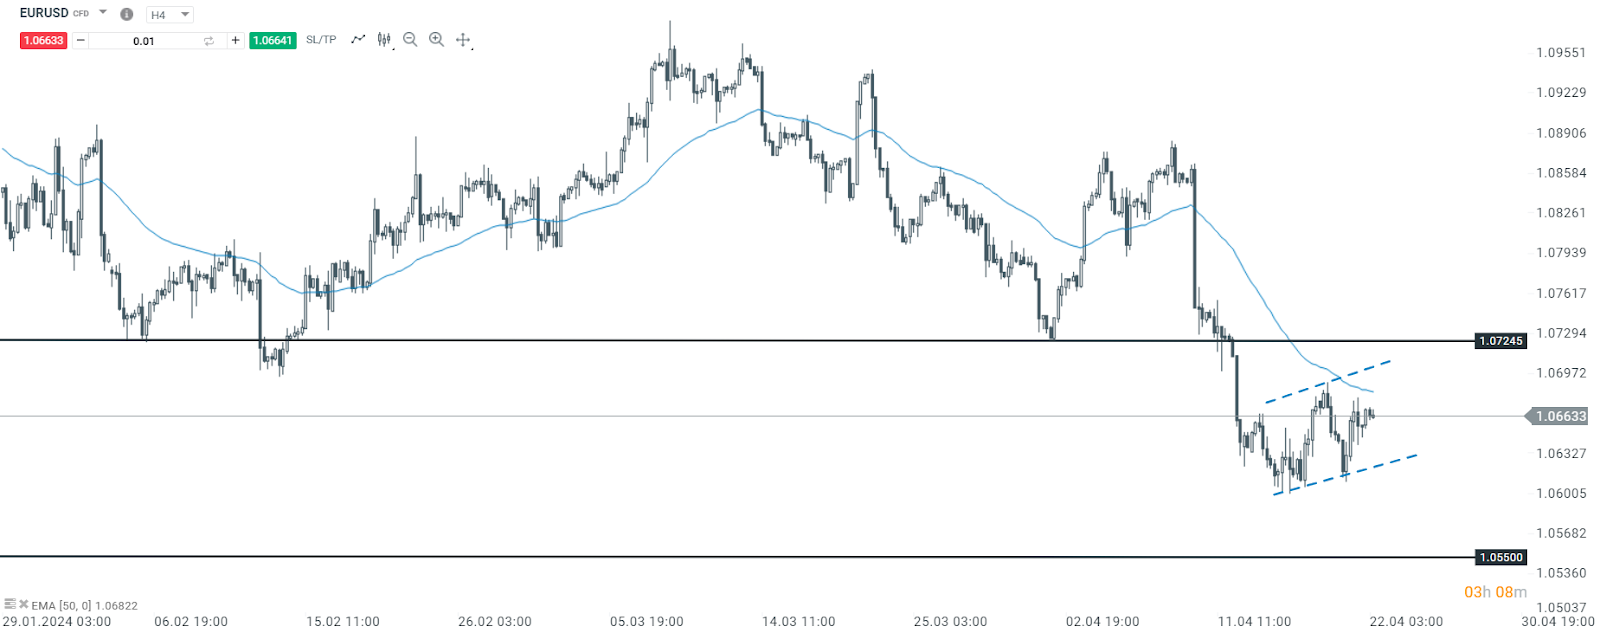
EUR/USD 4 hours time frame chart. Source: xStation 5
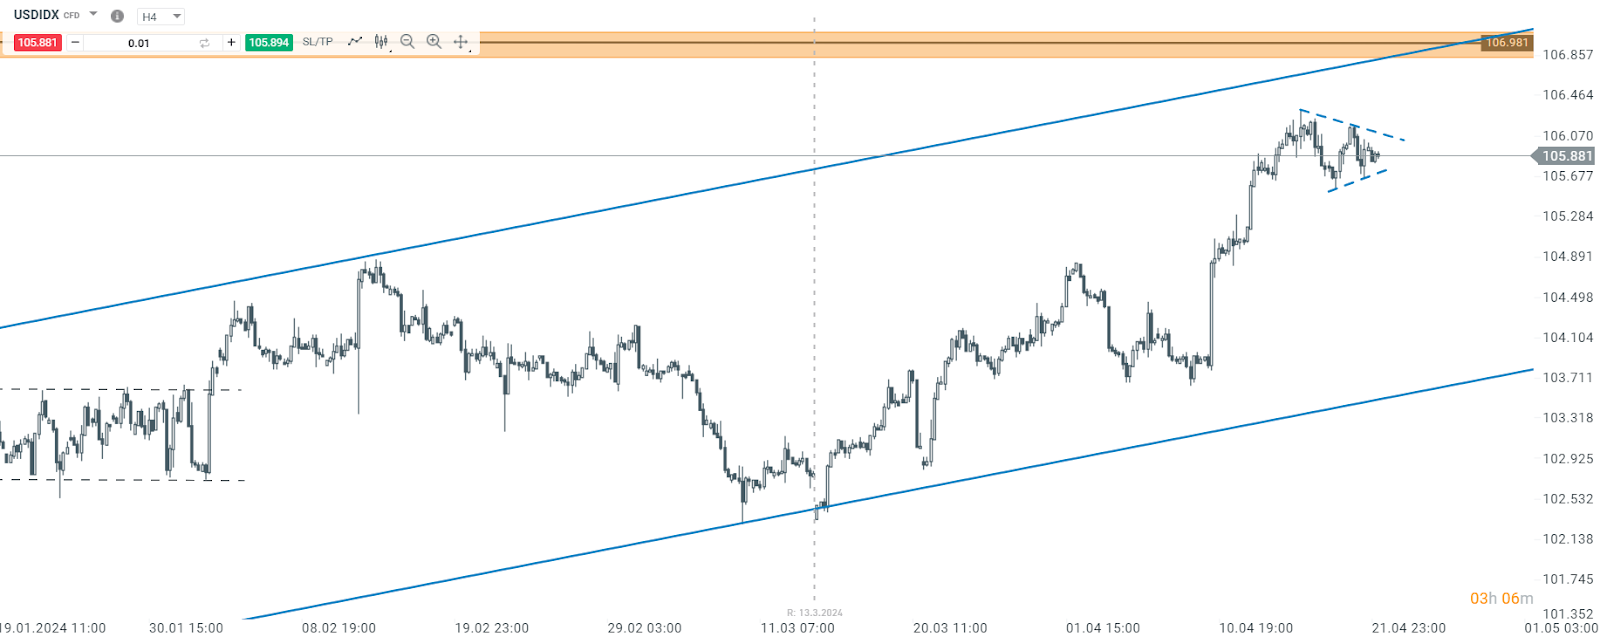
Dollar Index, 4 hours time frame chart. Source: xStation 5
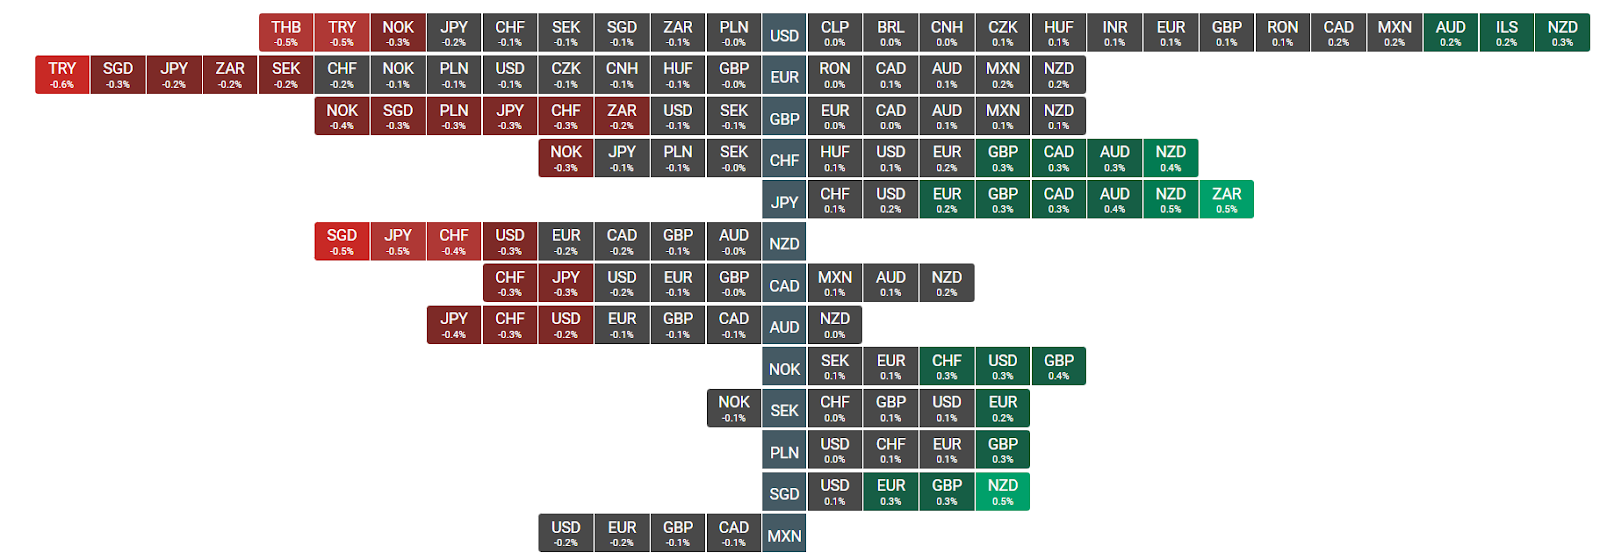
Forex Heatmap. Source: xStation 5
Henrique Tomé,Analyst Portugal


Market Wrap: Clear rebound in Europe against falling oil price. Assets related to Brazil in retreat


Chart of the day: European gas ever closer to 100 EURMWh


Economic Calendar - German Ifo index, Middle East escalation, and Wall Street giants' earnings



Elections in Brazil: Lula returns to power, markets react with panic. Brazilian ETF loses nearly 15% in Tokyo. What about USDBRL, soybeans, sugar, BRAComp, and ETFs?