
The main currency pair has been recently moving sideways. Despite breaking above resistance area at 1.2240, which coincides with February’s highs, buyers were not able to keep up their strength and EURUSD was sent lower. Taking at look at the daily chart, one might spot that a potential bearish engulfing pattern is being formed at press time. The pattern usually heralds declines. If the ongoing move deepens, traders should look at support area near 1.2170 which results from previous price action and the lower boundary of an upward channel. In case the currency pair breaks below this threshold, the downward move could potentially accelerate.
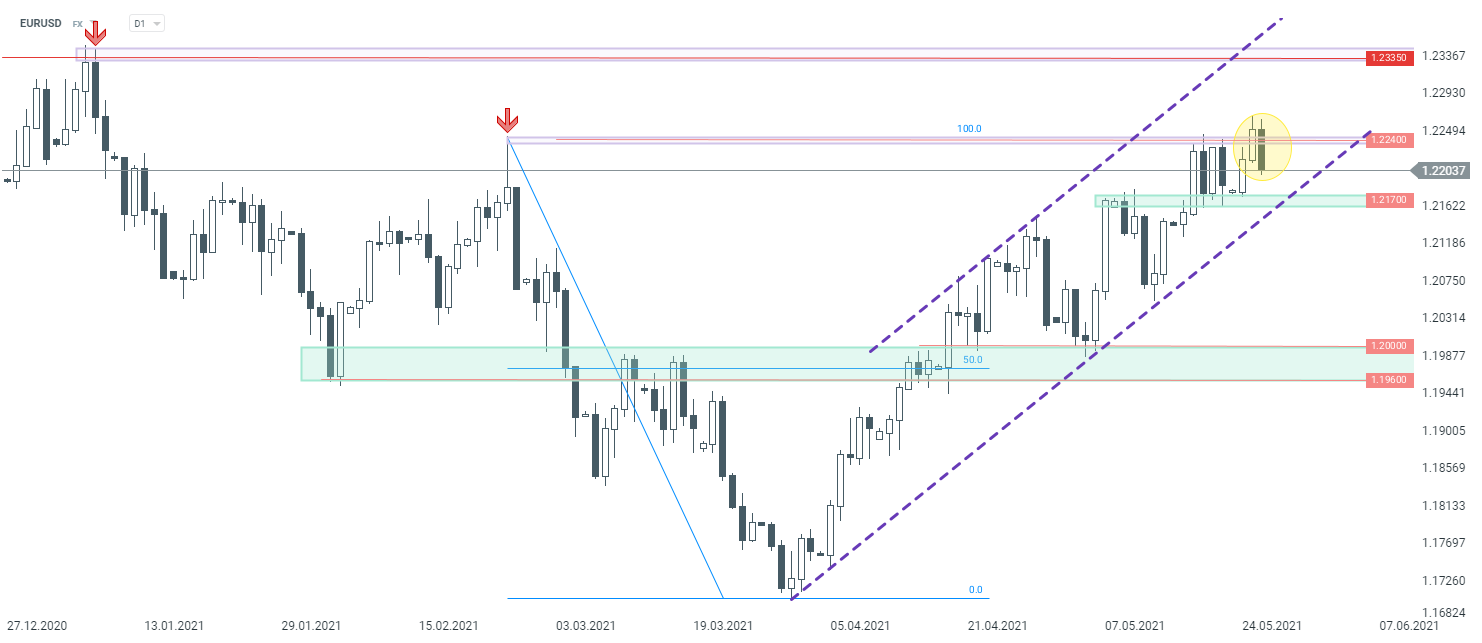 EURUSD, daily interval. Source: xStation5

Daily Summary: Wall Street Regains Ground; Another Intervention in the Yen Market❓

Three Markets to Watch Next Week (July 31, 2026)

Market Wrap: European equities at 3-week highs! Apple dips in US premarket!

Chart of the Day: EURUSD after the Fed meeting. The market scales back rate hike expectations