Alongside its interest rate decision, the Fed has published its latest "Summary of Economic Projections" (SEP). The June report paints a rather hawkish, and perhaps even slightly stagflationary, picture of the economy: a lower GDP growth rate paired with a sharp rebound in inflation. On the other hand, inflation appears to be transitory, as the Fed still expects it to return to target in 2028, unchanged from the March meeting. Nevertheless, the dot-plot projection points to a rate hike this year, though the distribution of votes doesn't necessarily guarantee it.
At the same time, the updated forecasts dash hopes of a swift return to loose monetary policy. Instead, the Fed is preparing markets for a scenario where the fight against inflation is far from over. Interestingly, the projections reveal much more than the statement itself, which is arguably record-short...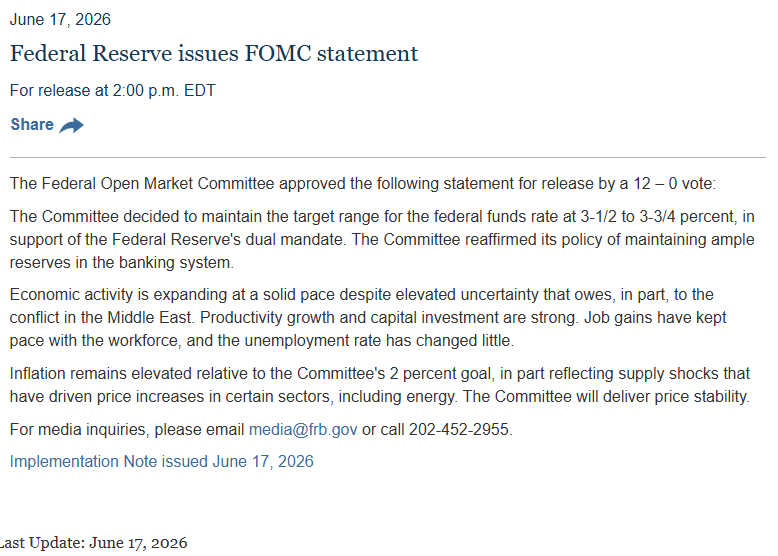
Macroeconomic Revision: Less Growth, More Trouble
The latest macroeconomic projections bring key and distinct changes compared to March expectations:
-
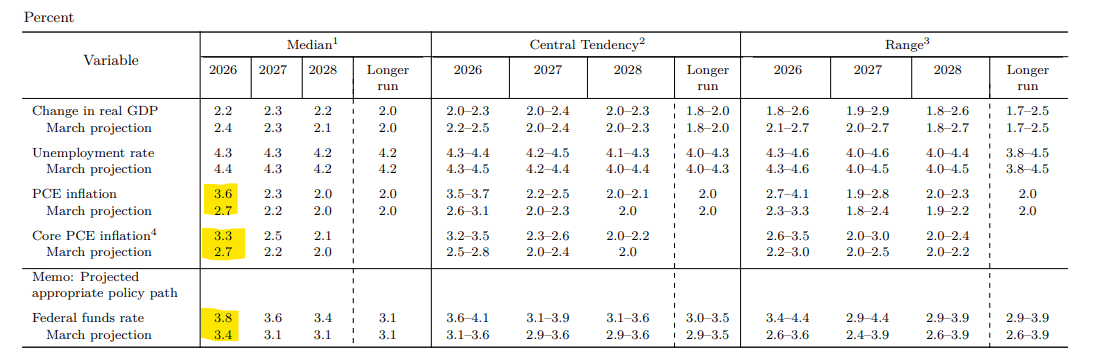
GDP growth is slowing down: The economic growth forecast for 2026 has been revised downward to 2.2% (from 2.4% in March). The long-run growth potential of the US economy remains unchanged at 2.0%.
-
Inflation surge: This is the most concerning element of the report. PCE inflation in 2026 is expected to hit as high as 3.6%, a dramatic leap compared to the March forecast (2.7%). A similar situation applies to core PCE inflation (excluding food and energy prices), which is projected at 3.3% (vs. 2.7% in March). This is, however, a result of the recent energy crisis.
-
Distant inflation target: The Federal Reserve maintains that inflation will not return to the 2.0% target until 2028. The statement indicates that the elevated price dynamics are a result of factors including supply shocks, such as turmoil in the energy sector.
-
Strong labor market: Paradoxically, the only "bright" spot (though problematic from the standpoint of fighting inflation) is the labor market. The unemployment rate forecast for 2026 has been lowered to 4.3% from the 4.4% estimated in March.
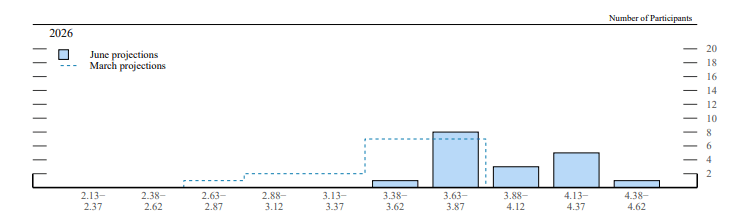
Dot Plot: Rate Hikes Are Back on the Table
However, the biggest surprise for investors is the new dot plot (the chart showing FOMC members' expectations for interest rates). While the market was pricing in a series of cuts until recently, the Fed is delivering a cold shower:
The chart implies a 25 basis point interest rate hike in 2026. Furthermore, the path for potential easing in subsequent years is exceptionally flat: the Fed projects a cut of just 25 bps in 2027 and another modest 25 bps in 2028.
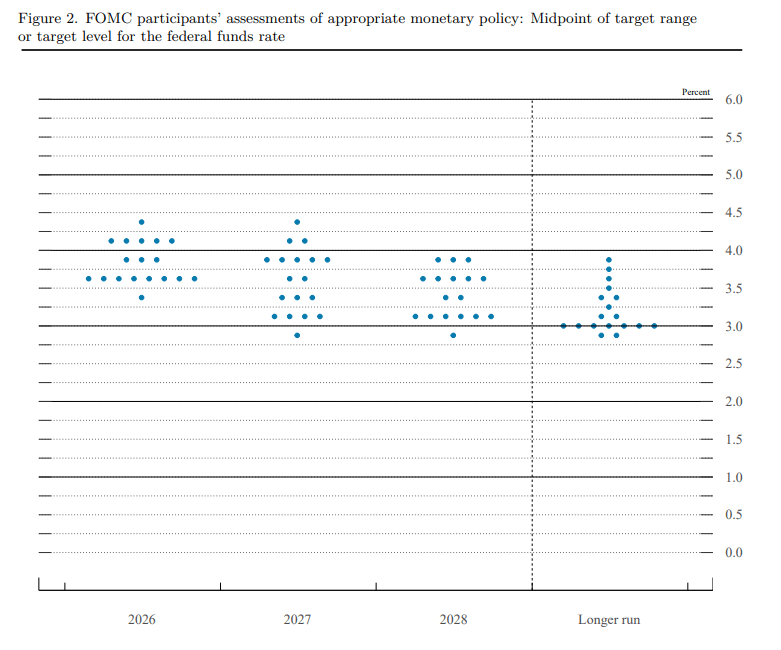
The famous market mantra "higher for longer" has just taken on a new, even more restrictive meaning.
However, it is worth noting that the majority of votes sit in the 3.6–3.8% range, which means a large portion of members may still not see a hike this year.
What Does This Mean for Financial Markets?
Such a hawkish shift in the Fed's communication and the data revision toward lower growth and higher inflation in 2026 could mean continued upward pressure on yields, while simultaneously strengthening the US dollar if the hawkish message takes hold in the market over the coming weeks and months. At the same time, this is terrible news for gold and stock indexes.
The "supply shocks in the energy sector" mentioned by the Fed suggest that oil and natural gas prices may remain structurally higher, which will support the valuations of companies in this sector.
For Wall Street, this is a highly negative scenario. Higher costs of capital (rates) will hit corporate valuations, particularly the interest-rate-sensitive tech sector and growth stocks. At the same time, the lowered GDP forecasts raise concerns about future corporate earnings. We can expect a rotation of capital away from risky assets toward defensive sectors, high-dividend-paying stocks (value), and the energy sector, which, according to the Fed itself, is still experiencing price shocks.
Gold is erasing gains from the two previous sessions, disregarding the gap created at the weekend opening when a tentative agreement between the US and Iran was reached.
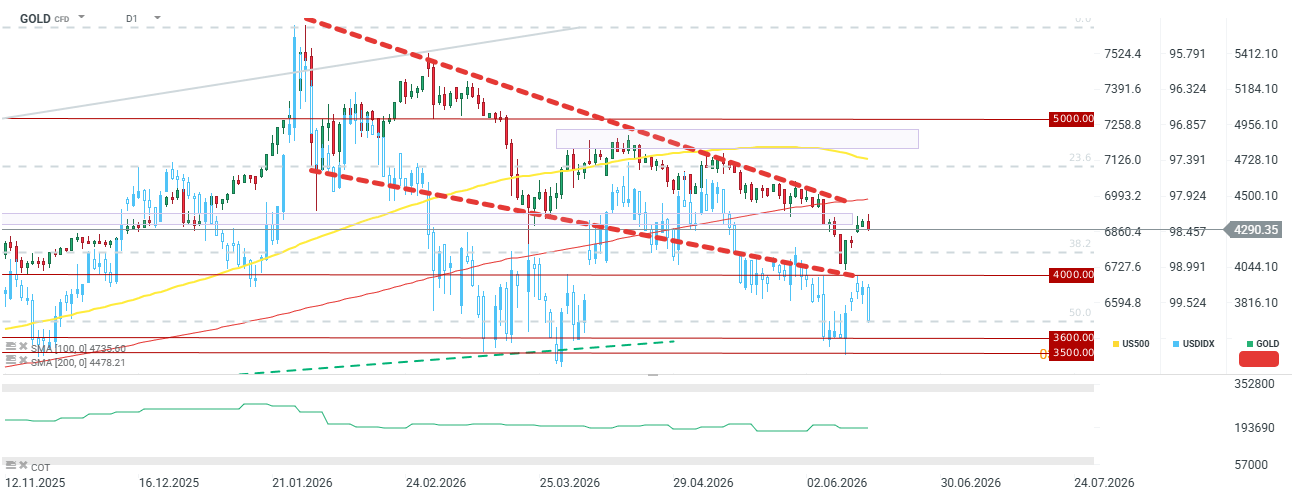
Source: xStation5
It's worth noting that Kevin Warsh has indicated that his working groups will be working on various changes, including changes to the projection, possibly including abandoning the dot chart. He himself has not decided to "mark" his dot on the dot chart.

BREAKING: BoE Keeps Rates Unchanged

🛢️Further escalation and tense situation do not drive oil further

Daily Summary - The market starts to doubt rate hikes after Warsh, but Trump destroys the rebound

Not so hawkish words, dovish dodges. EURUSD at 1.1450 during Kevin Warsh's Q&A