



The rise in gold prices around 4,345 USD right before the Fed decision stems from discounting alternative scenarios, profit taking on short positions due to falling oil prices, and hedging against risks surrounding political consistency and hawkish central bank rhetoric.
Scenarios for gold ahead of the upcoming event:
- No rate hike (dovish surprise): The market prices in a 91% probability of a rate hike. A decision not to move would undermine Fed credibility, triggering a sell-off in the dollar, a fall in bond yields, and a surge in demand for the precious metal.
- Rate hike with announcement of a pause ("Dovish hike"): Raising rates while signaling the end of the cycle (partly thanks to cooling energy prices) would open the door to continued gains in the price of gold.
- Hawkish hike (rate hike + announcement of further moves): A rate hike by K. Warsh and a firm stance on inflation will maintain high 10-year bond yields (~5%), putting downward pressure on gold.
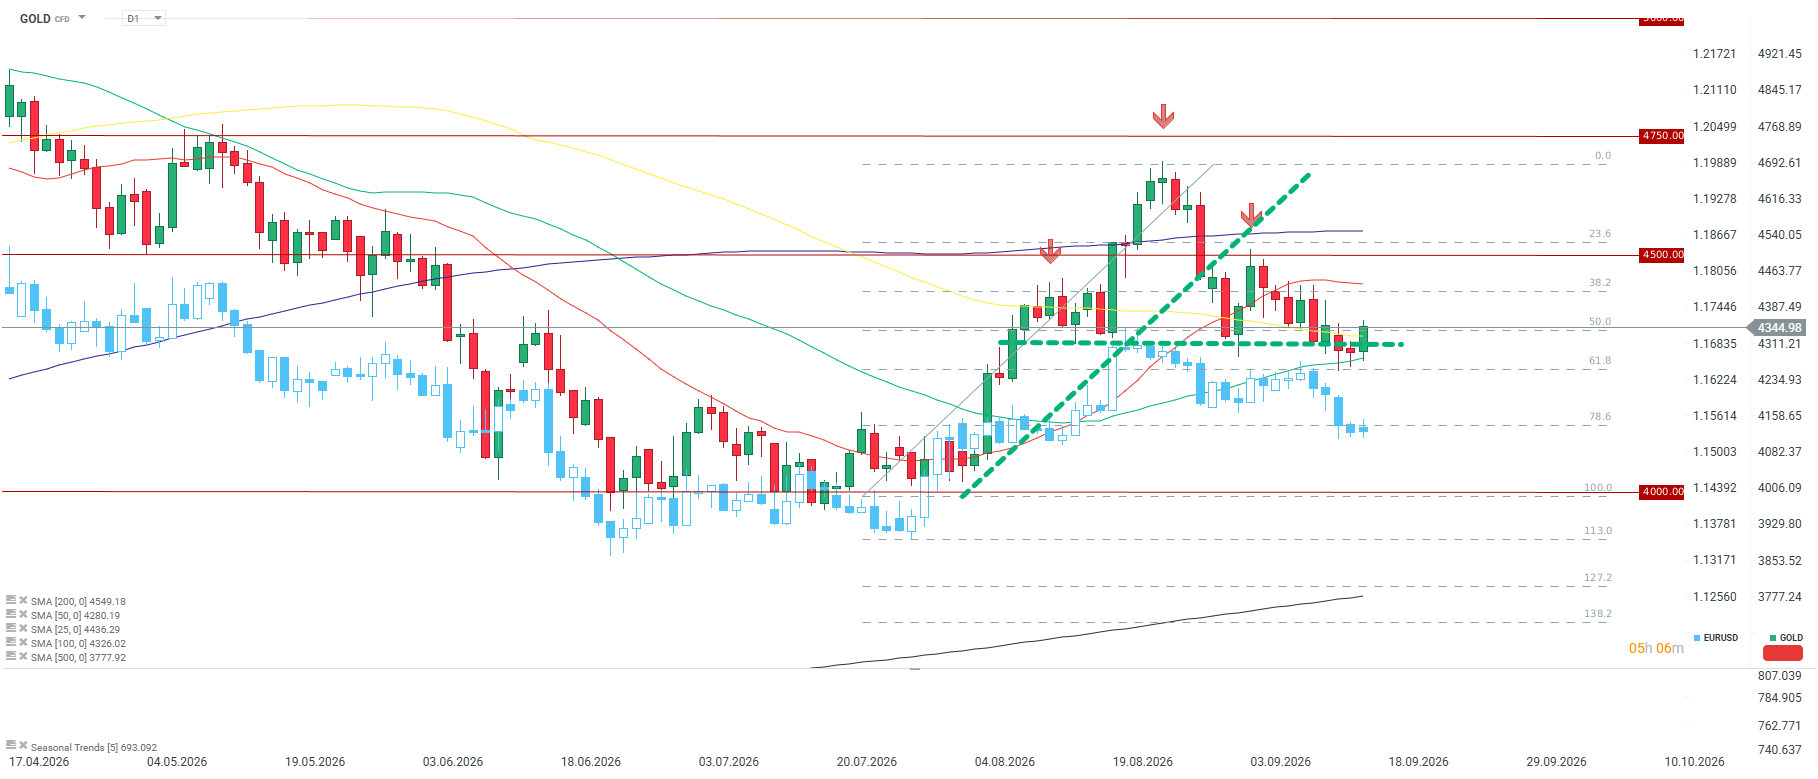
The daily gold chart is at a crucial turning point, trading near 4,345 USD. After a local slowdown and a break of the previous dynamic upward trendline, prices have stabilized in a market consolidation zone. The market is currently relying on support defined by the rising 100 SMA (4,326 USD) and a key Fibonacci retracement area (50.0%–61.8%). This setup indicates a defensive attempt by buyers to build a base. For market bulls, the first significant hurdle remains the supply zone located around 4,436 – 4,500 USD. Within this range lie the short-term 25 SMA and a strong horizontal resistance level. Only a sustained breakout above this range would open the path to a resumed move towards the 200 SMA (4,549 USD), overcoming which is a necessary condition for a potential test of this year's high near 4,750 USD.
From a downside perspective, failing to defend and breaking below 4,326 USD will open the path for sellers to test the lower 50 SMA (4,280 USD). Breaking this barrier could aggressively deepen the correction and drive prices toward key psychological support at 4,000 USD, which forms the low of the current market structure.



Market Wrap: Oil rises again, French fiscal concerns weigh on euro (07.10.2026)



Oil falls below $100🚨
💶Chart of the Day: EURUSD at Lowest Since May 2025 Amid French Fiscal Crisis

Morning Briefing: Dollar gains, oil falls. EURUSD at multi-month lows