On Tuesday 20th april, Topix dropped by 1,2% and NIKKEI (JAP225) tumbled by 2%, but the BoJ did not intervene - this was the first time since 2016 that the BoJ did not make an ETF purchase after such a decline in the morning session. The day after, the BoJ made the first purchase since March (70.1BN yen of ETFs), but japanese indexes kept under pressure as rising coronavirus infections in Japan capped gains. In this analysis we will focus on three intervals and try to figure out the perspective of the NIKKEI (JAP225).
Daily interval :
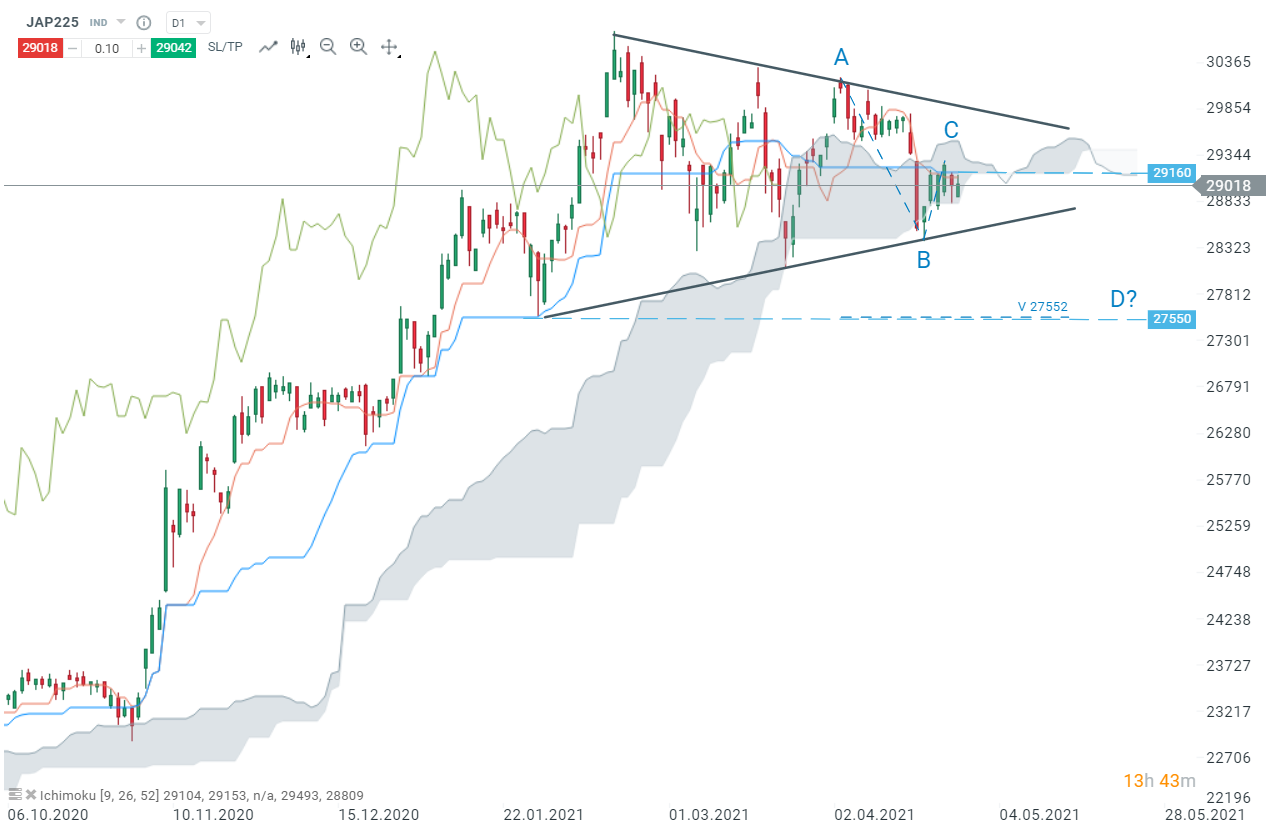
After a rebound on the lower limit of the triangle (B), JAP225 could not break above the Kijun-line (blue line) at 29 160 pts and remained inside the daily Ichimoku cloud. In case bulls managed to keep prices inside the cloud, another upward impulse may be launched. On the other hand, breaking below the lower limit of the triangle could result in a deeper downward move. In such a scenario, the first support to watch can be found at 27 550 pts.

JAP225, D1 interval, Source : xStation5
H4 interval :
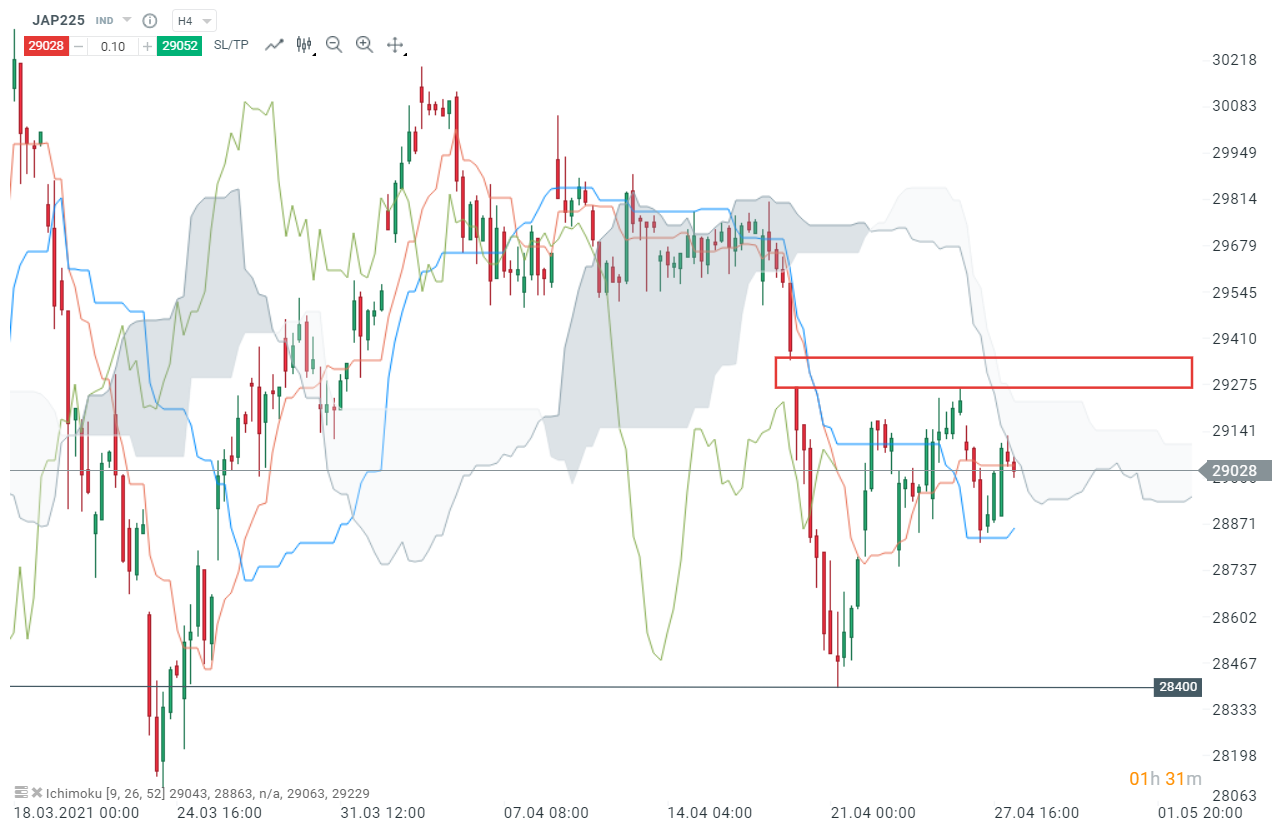
On 26th of April, prices failed to fill the bearish price gap (red box) and dropped to the H4 Kijun-line (blue line) at 28 830 pts. Bulls managed to defend this support and an upward move led to the next resistance - the H4 Ichimoku cloud. This cloud is still acting like a strong resistance and pushing prices lower. The next support is the aforementioned Kijun-line at 28 830 pts. Breaking this level could lead to a deeper downward move to the next resistance at 28 400 pts. On the other hand, if bulls manage to cross the H4 cloud, a strong resistance can be found at the bearish price gap (red box).

JAP225, H4 interval, Source : xStation5
H1 interval :
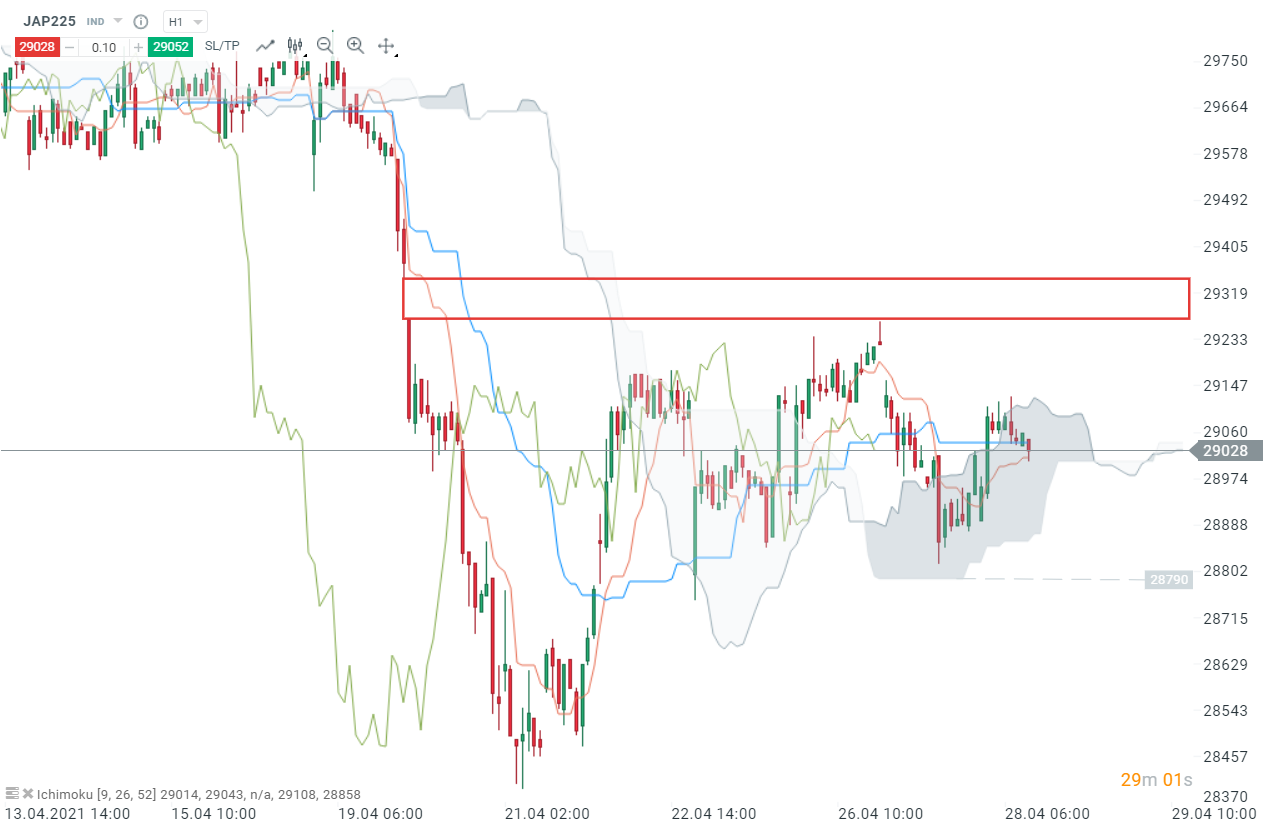
When analysing this short interval, one can notice that prices are located inside the cloud. According to the theory, this tells us that the market equilibrium is reached. Should break of the lower limit of the cloud occur, then downward move may be extended to the previous Senkou-span B level (grey line) at 28 790 pts. This level is the last support before the local lows at 28 400 pts. On the other hand, if buyers will manage to halt declines on the Tenkan-line (red line), then another upward move towards the upper limit of the cloud at 29 120 pts is possible.

JAP225, H1 interval, Source : xStation5
Réda Aboutika, XTB France

Daily summary: Weak US data drags markets down, precious metals under pressure again!

US Open: Wall Street rises despite weak retail sales

US2000 near record levels 🗽 What does NFIB data show?

Chart of the day 🗽 US100 rebound continues as US earnings season delivers


