
Yesterday most of the major currencies pairs dropped as the US dollar index (USDIDX) rose, taking advantage of its safe haven status. USDCAD was the one benefiting from it but now it is reacting on the rebound of the oil market. On the other hand, NZDUSD was hit by the actions of the New Zealand government, which has taken steps to cool down the housing market. In this analysis, we will focus on the US dollar index on three intervals - monthly, weekly and daily - to find out the next resistances if bulls manage to keep de controle of the market .
Monthly interval :
In a monthly perspective, the US dollar found support at 89.700 mark and is now trying to reach the Tenkan-line (red line) at 93.500. If the monthly candle-stick manages to close above this level, the next target will be the Ichimoku cloud. As we can see on the chart, the Senkou-span A crosses the Senkou-Span B (yellow circle), forming a “twist” pattern, which is considered as a weakness of the cloud, and could allow prices to break over it. Giving that the cloud can be seen as a support or resistance, such a weakness makes it easier for prices to cross it.
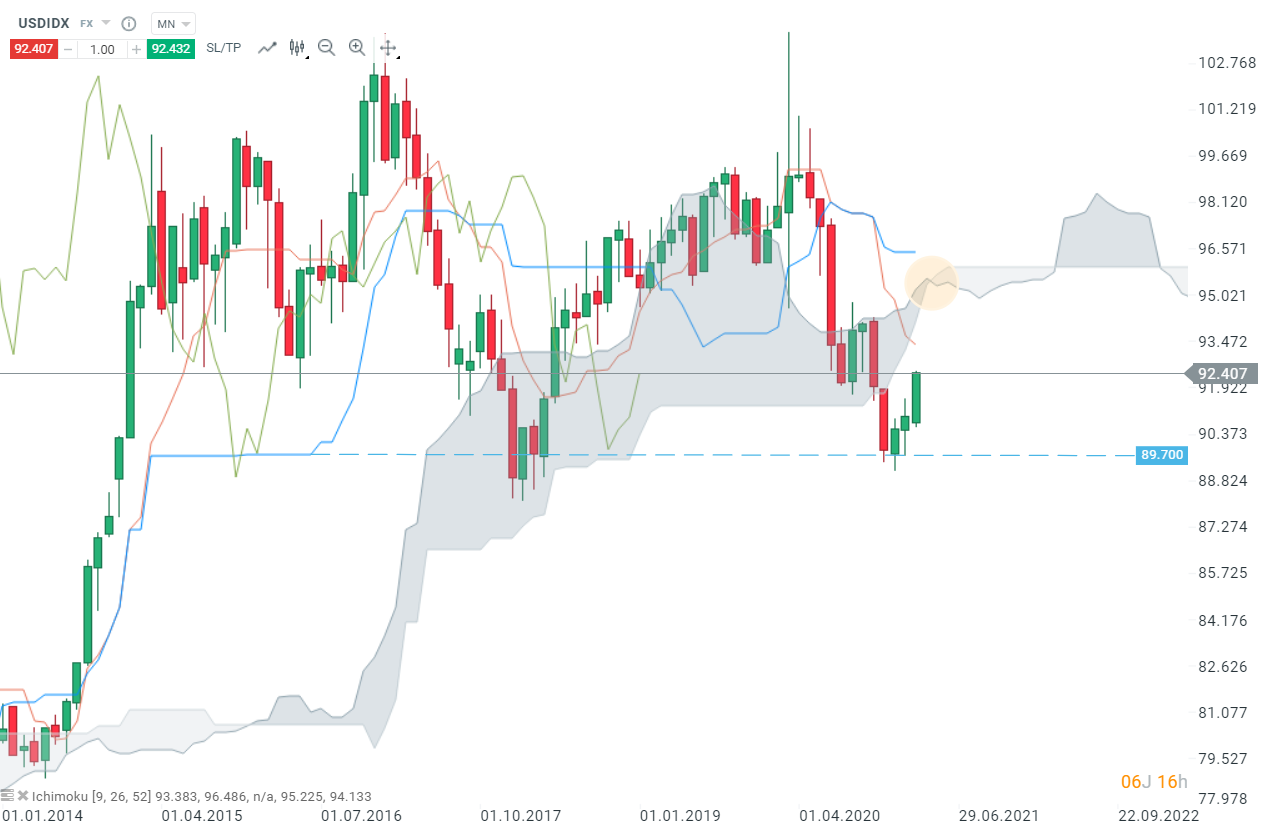
USDIDX, MN interval, Source : xStation5
Weekly interval :
When analysing the US dollar Index on a weekly interval, we can notice that a pattern similar to 2018 could be in play, when the first phase of a rally to the Ichimoku cloud, reinforced by the EMA100 (bold blue line), followed a trading range (red box). But this time, prices found a strong resistance (second yellow circle) around the Kijun-line (blue line). At the moment, the Kijun-line became a support and the next resistance is the EMA200, right before the ichimoku-cloud at 94,500.
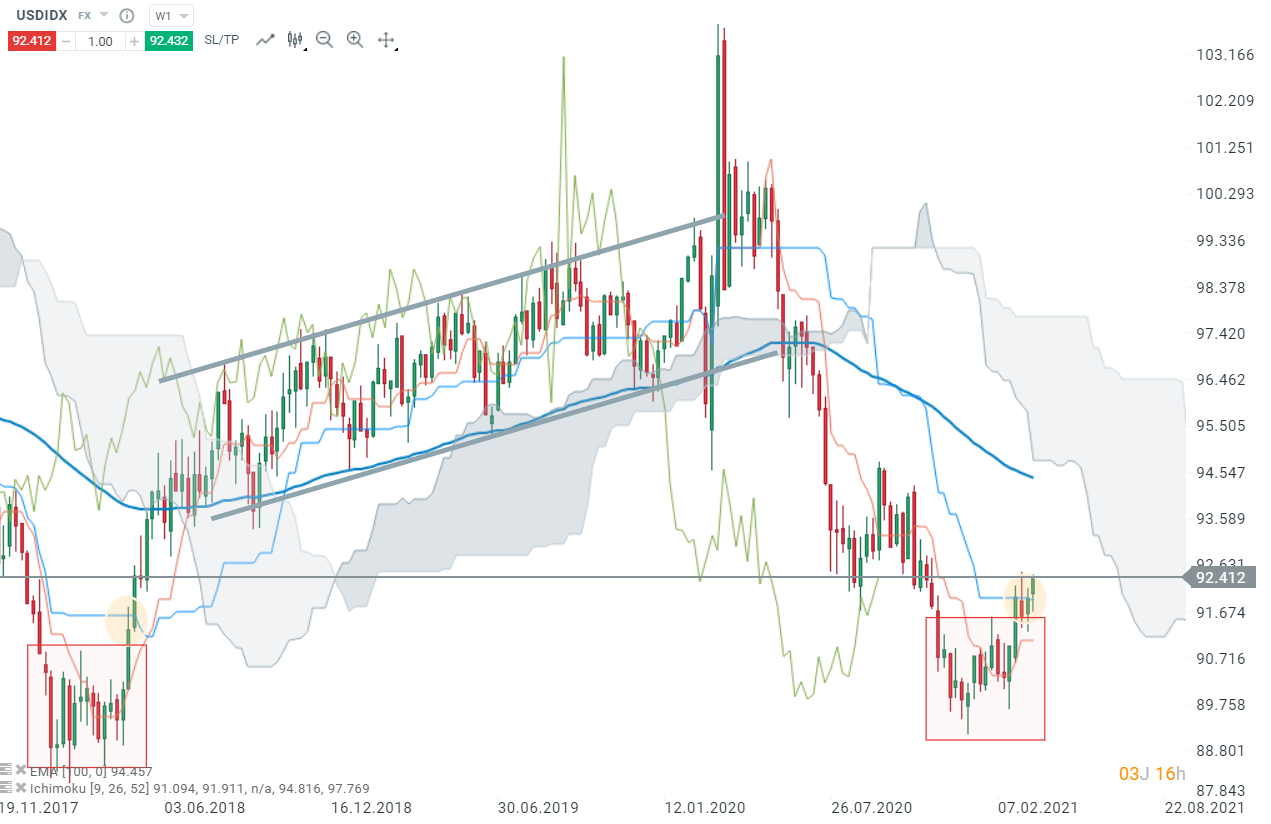
USDIDX, W1 interval, Source : xStation5
Daily interval :
The daily chart shows how difficult it is for prices to rise again. After a bullish pattern, when prices have broken the cloud (yellow circle), it took some time for the validation of this signal, given when the Chikou-span itself breaks the cloud (red box). If the daily candle-stick closes above the previous local high, around 92,520, the US Dollar index may look towards the next resistance in line around 93.200. In case bulls manage to reach and break above this hurdle, 93,740 will be the next resistance to watch. Remember that these aforementioned 93,200 and 93,740 handles are located around the monthly Tenkan-line.
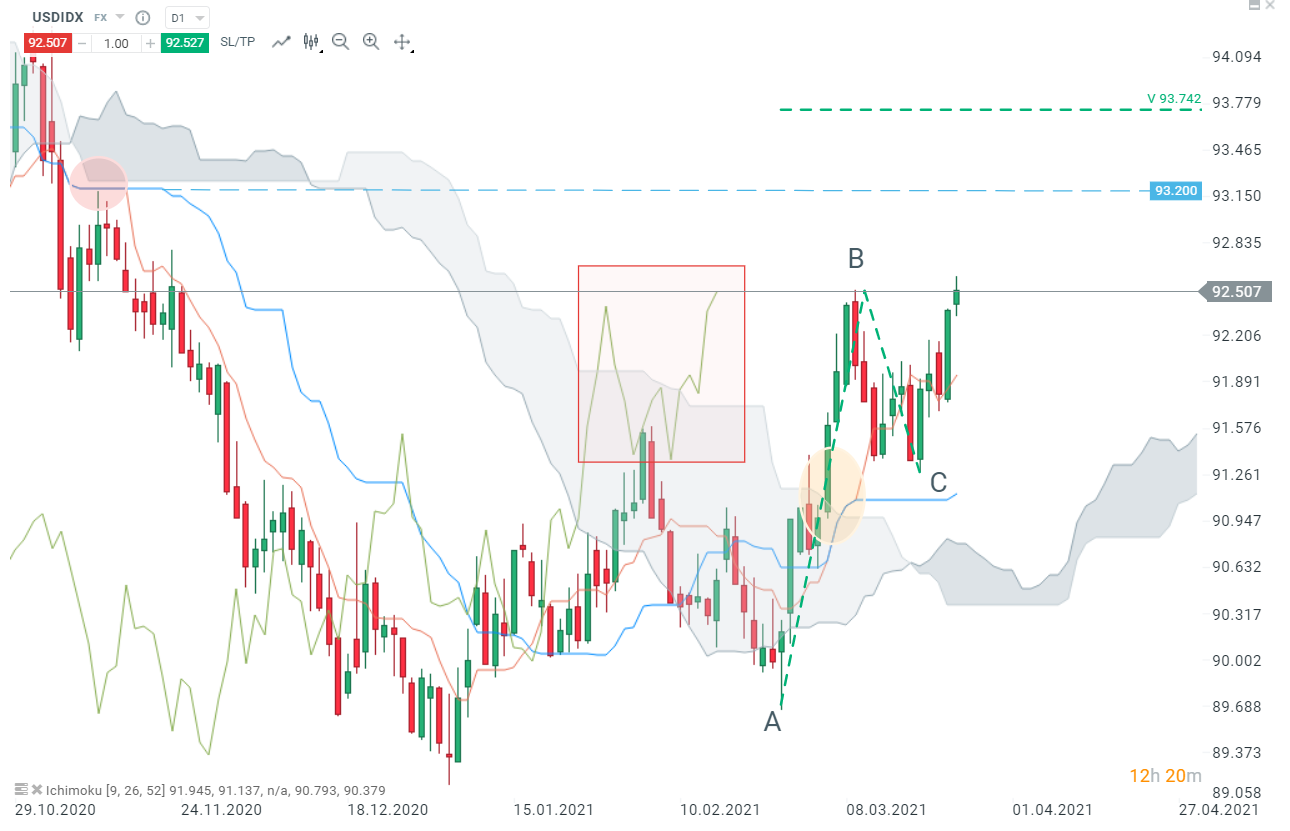
USDIDX, D1 interval, Source : xStation5

Daily Summary: Wall Street Regains Ground; Another Intervention in the Yen Market❓

Three Markets to Watch Next Week (July 31, 2026)

Market Wrap: European equities at 3-week highs! Apple dips in US premarket!

Chart of the Day: EURUSD after the Fed meeting. The market scales back rate hike expectations