
Despite the strength of the US dollar, gold is holding near $5,200 per ounce, which means the pullback from the all-time high around $5,600 currently stands at roughly 8%. Ongoing global geopolitical tensions, continued purchases and reserve diversification by central banks, and strong demand for hedging amid a global equity bull market all appear to be supporting gold’s fundamental demand. Similarly, robust retail investor interest in Asia is sustaining marginal demand for the metal, both in physical form and via ETFs. Looking at the GOLD chart, we can see that the price recovered relatively quickly from the late January–early February crash and is now attempting to return to record levels.
Recently, gold climbed to $5,250 per ounce, where it encountered the first significant resistance at the 71.6% Fibonacci retracement of the last downward impulse. Following the rally, demand cooled somewhat, but declines were halted around $5,130 per ounce, near the 61.8% Fibonacci retracement level. The price is now trading in the middle of this range, and a move back above $5,200 could increase the probability of a retest of local highs and a potential breakout toward new records. On the other hand, a drop below $5,100 could precede a stronger bearish impulse.
We also observe that the price is moving within a relatively narrow range, with the key lower boundary currently seen around $5,000 per ounce.
GOLD charts (D1, H1 intervals)
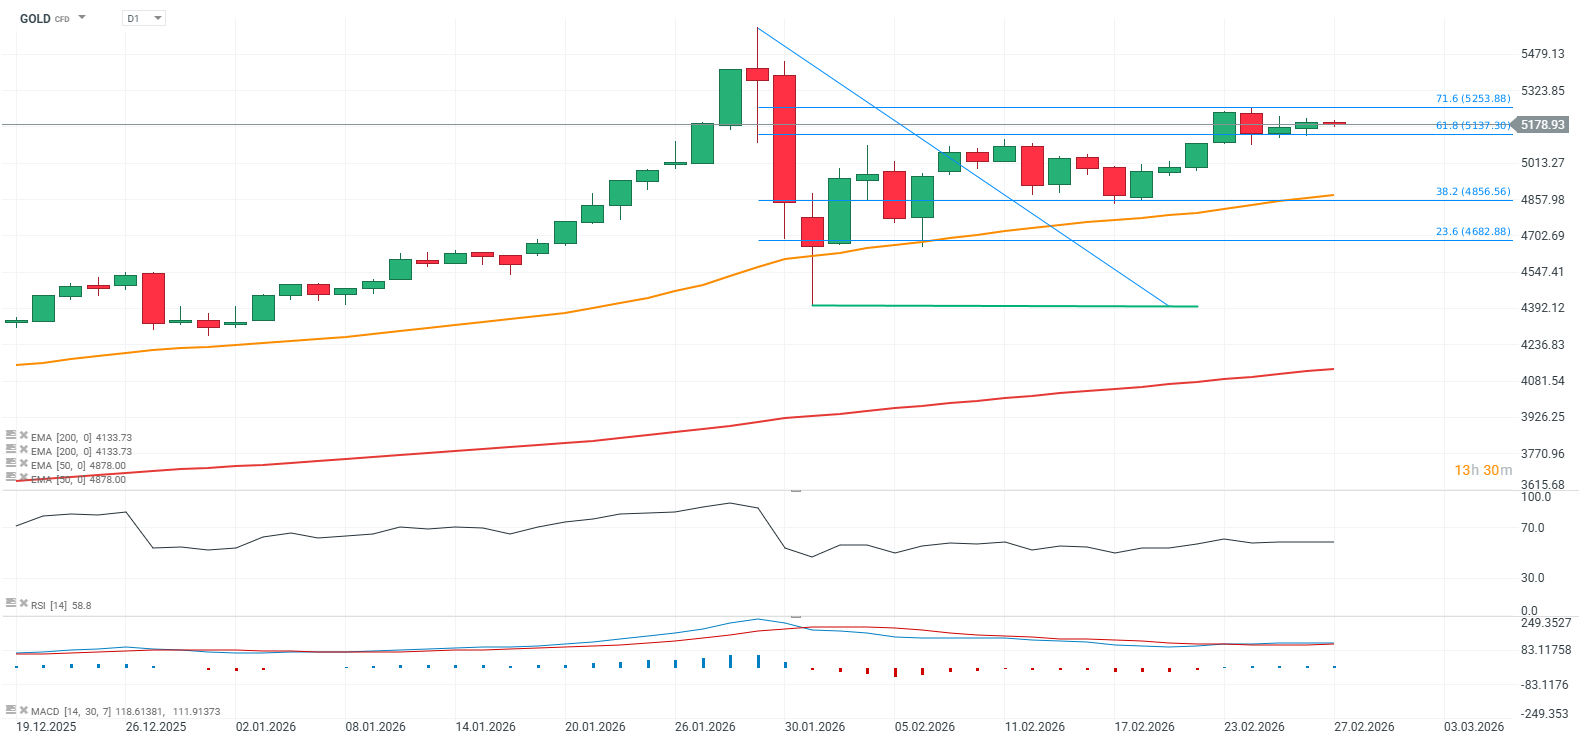
Source: xStation5
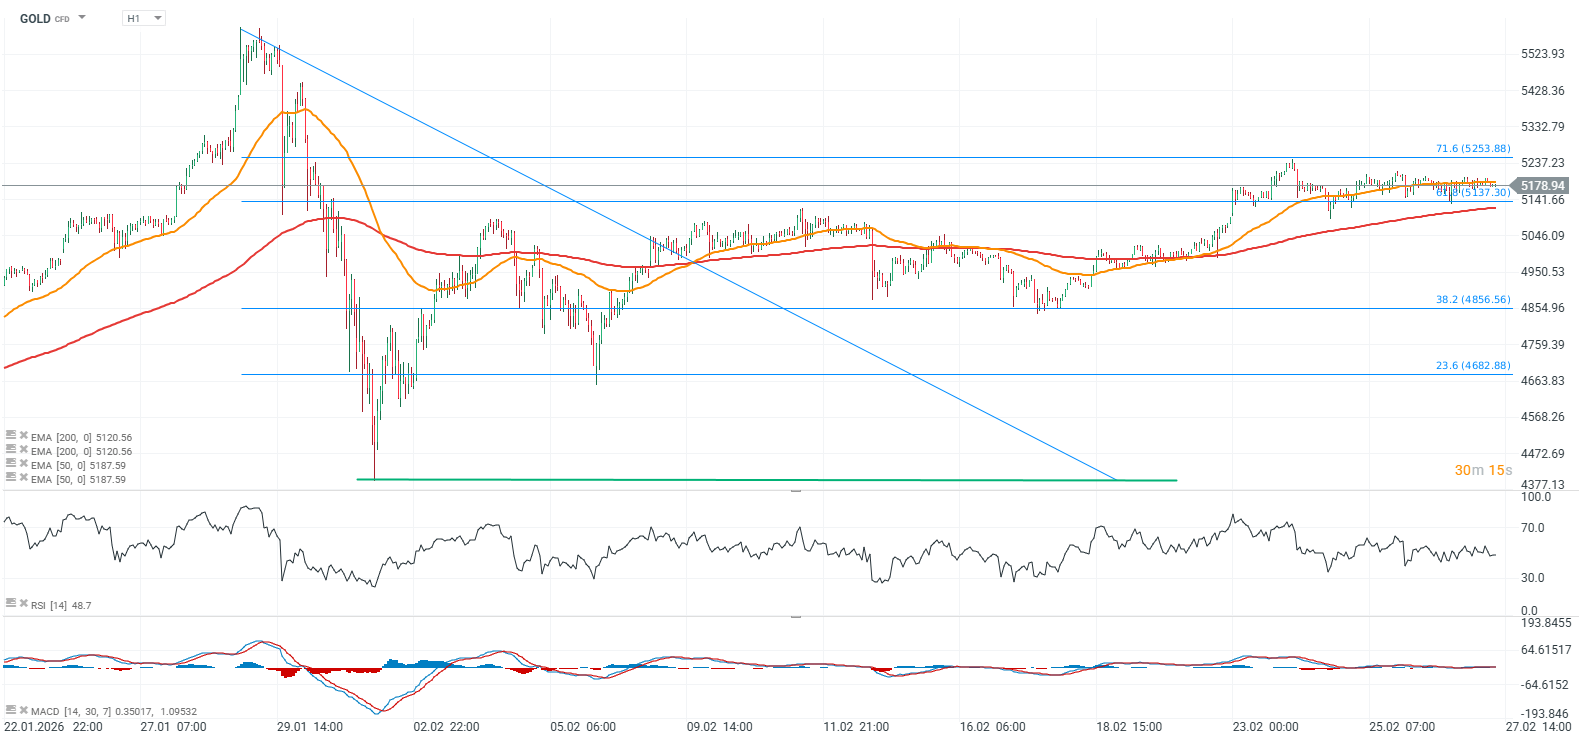
Source: xStation5
Daily Summary: A sell-off with a spin-off

Three Markets Worth Watching Next Week (17.07.2026)

Iran Escalation: What to Watch and What to Expect

US OPEN: The market extends losses as investor concerns grow