
Morgan Stanley (MS.US) revenues in Q3 was slighlty higher on yearly basis and earnings per share were not enough high to cause the optimistic reaction on the financial report. Provision for credit losses surged more than 350% y/y. Now bank shares loses 2% before the market open after revenues from wealth management and especially investment banking disappointed investors.
- Revenues: 13,3 mld USD vs 13,25 mld USD expected
- Earnings per share (EPS): 1,38 USD vs 1,32 USD expected
What's more revenue from the fixed-income trading (FICC) slumped 11% with lower fees from dealmaking. Finally net income dropped. Net new assets slumped to $35.7 billion from $89.5 billion the prior quarter.
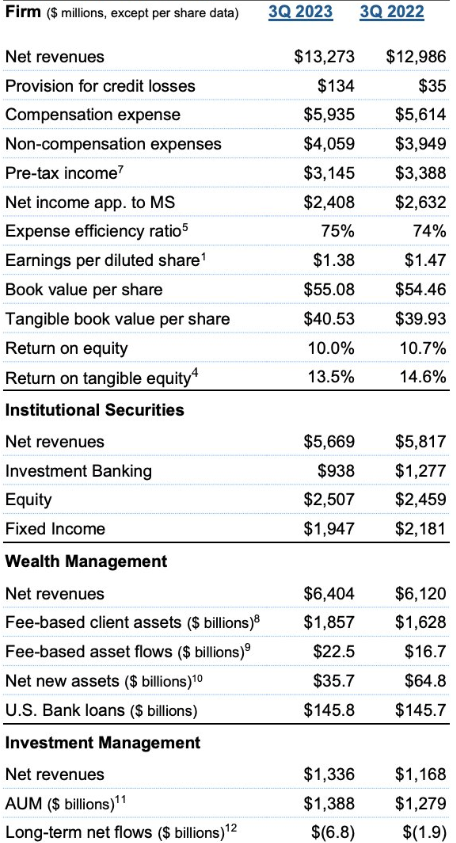
Morgan Stanley revenues on y/y basis. Investment Management revenues dynamics was higher y/y with increasing AUM but it wasn't enough to boost earnings. Revenues from Fixed Income and even Investment Banking were lower y/y. US bank loans increased just by $1 milion to $145,8 million. Source: Morgan Stanley report
Morgan Stanley (MS.US) chart on W1 interval
We can see that the price of Morgan Stanley shares dropped below SMA200 on W1 (red line) and 38,2 Fibonacci retracement level of upward wave from April 2020. Levels below 78 USD per share may signalize further and longer weakness. Last time when price dropped below SMA200 was in 2020 and 2008 during GFC.
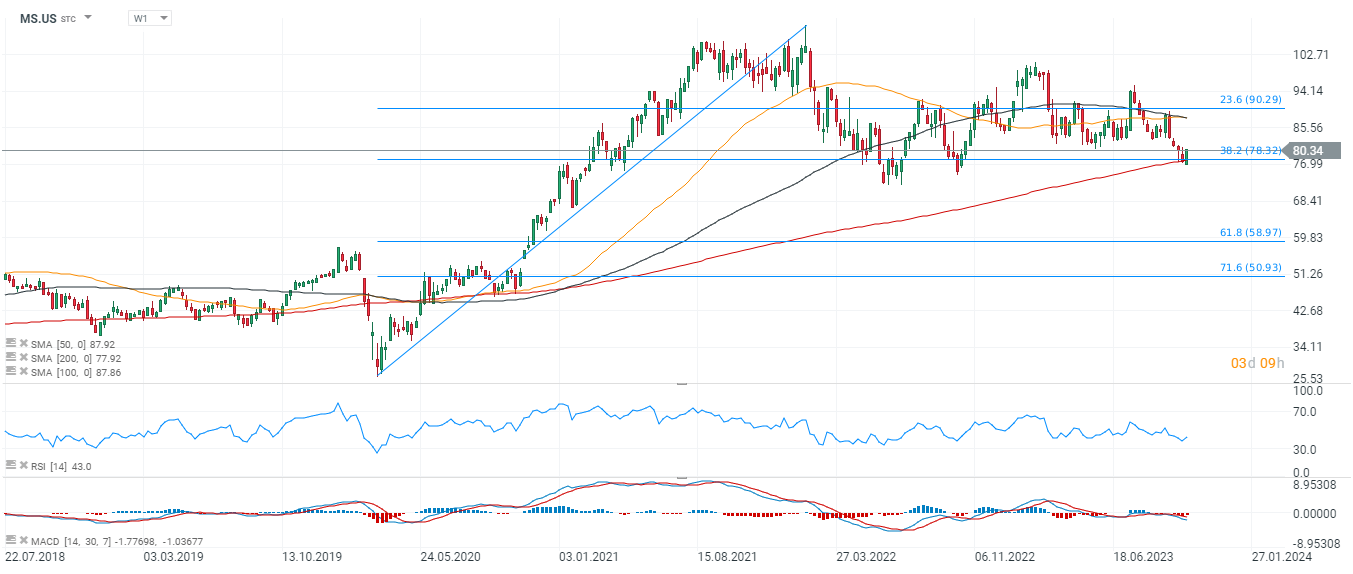 Source: xStation5

Meta Announces Its Own AI Chips. Is the Era of Full Dependence on NVIDIA Slowly Coming to an End?

Vodafone shares surge 13% after Xavier Niel's £4.4 billion investment. What's next for the stock?

🚩 Apollo Global warns on AI: Has the market become too optimistic?

Stock of the Week: Seagate Technology. How an old technology found a new role in the era of artificial intelligence