
OIL (D1 interval)
Oil market has been trading in an upward move since the beginning of November 2020. However, price started to move lower after painting a fresh post-pandemic high in March 2021. Looking at Brent (OIL) at the daily interval, we can see that the price broke below the upward channel and reached the key support. Green area on the chart below is marked with previous price reactions as well as the lower limit of the Overbalance structure (the biggest correction during the whole upward move started in April 2020). Should buyers manage to halt declines there, another upward swing impulse may be about to start. On the other hand, breaking below it may trigger a bigger downward move.
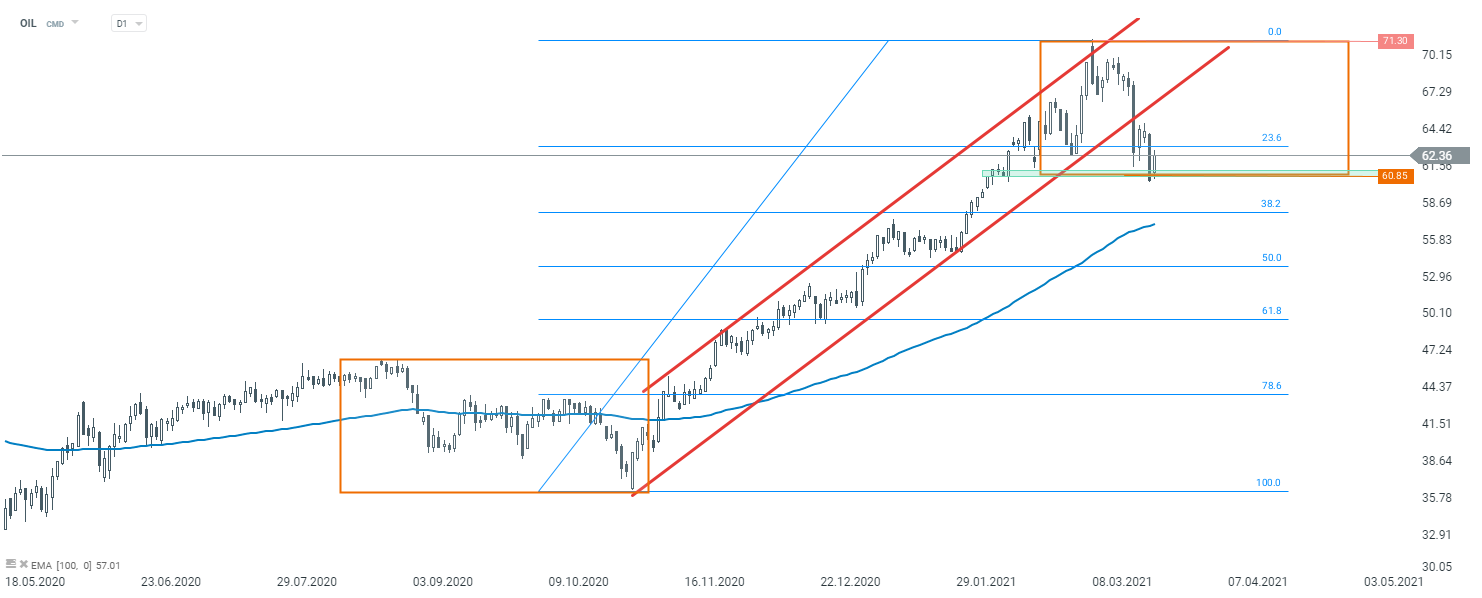 OIL D1 interval. Source: xStation5
OIL (H4 interval)
Looking at OIL at a lower time frame, we can see that a potential head and shoulders pattern is building up. According to classic technical analysis, sell signal will appear once the price breaks below the support at $60.85,which is the support from which the price bounced off today. The nearest resistance to watch can be found at the $63.65 mark, which is a result of a local 1:1 structure, and the next resistance can be found at $66.65.
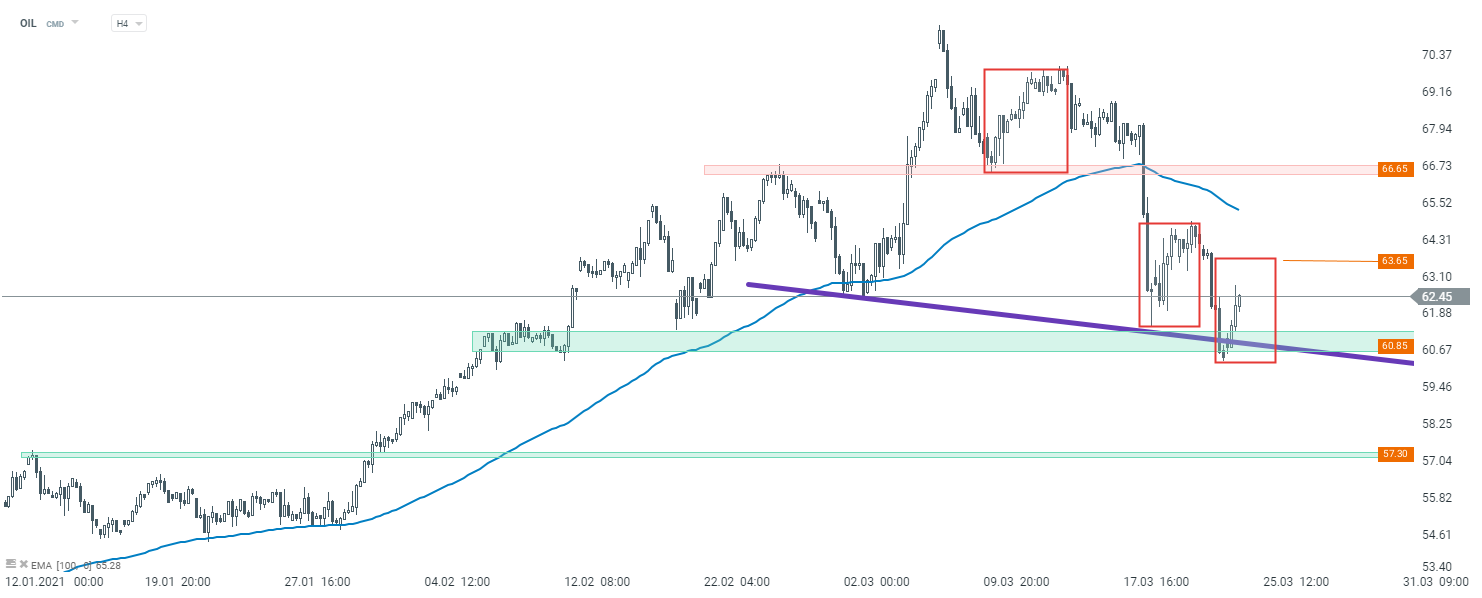 OIL H4 interval. Source: xStation5
ExxonMobil (XOM.US)
Last but not least, let's have a look at one of the biggest oil companies in the world - ExxonMobil (XOM.US). Looking at the daily interval, one can see that the price of this stock has been trading in an upward trend recently. However, the recent downward correction on the oil market has also resulted in the downward move on ExxonMobil shares. The stock is trading below the key support, which is marked with the lower limit of 1:1 structure, and the 33 - period moving average, which has acted as a key support in the past. Should today's daily candlestick close below the $55.70 area, the bigger downward correction may be on the cards. The next key support to watch lies at $51.00, where the 38.2% Fibonacci retracement and the previous price reactions are located.
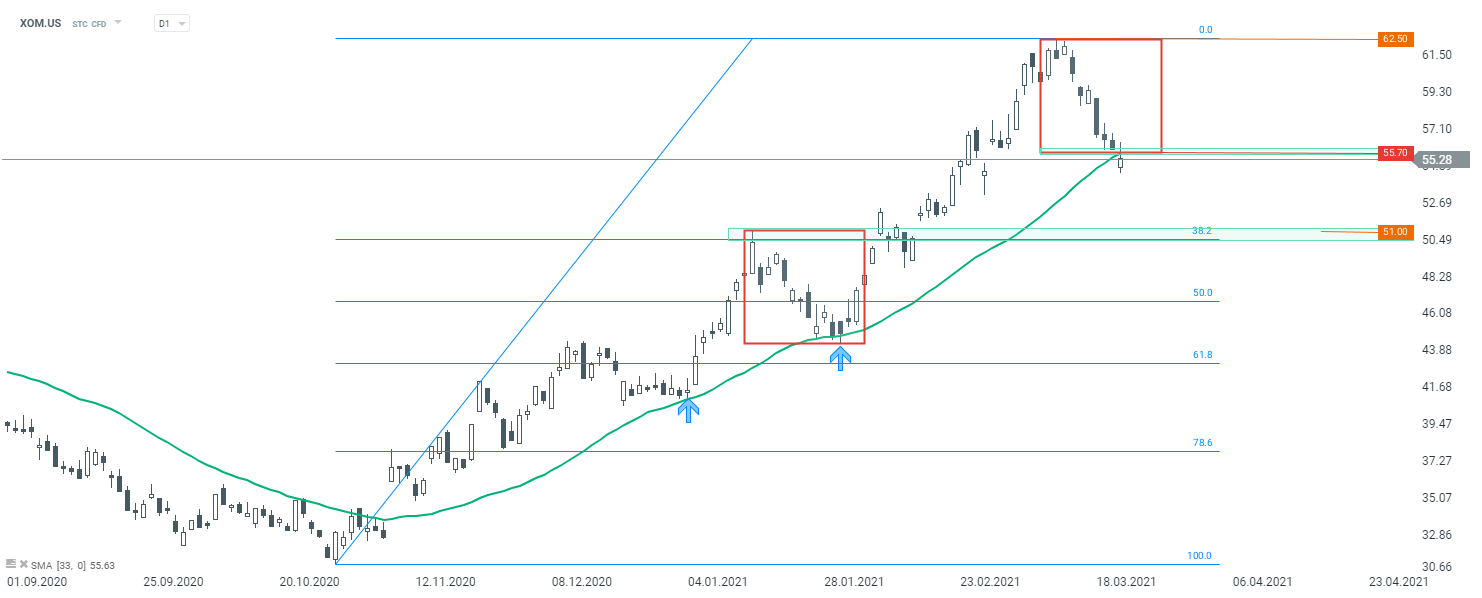 ExxonMobil (XOM.US) D1 interval. Source: xStation5

When will the rise in oil prices reach us?

Daily Summary: Equities Diverge as Tech Lags, Europe Rallies on Earnings & PMIs (24.07.2026)

Three markets to watch next week (24.07.2026)

Oil Slides Ahead of the Weekend!