
Oil continues to trade near but has not yet managed to close a bullish price gap, triggered by an unexpected OPEC+ output cut announcement. A bearish sentiment can be spotted on the crude market since mid-April and is trading less than $1 per barrel away from closing a bullish gap. Taking a look at OIL.WTI at the D1 interval from a technical point of view, we can see that downward move accelerated after the price failed to break above $82 resistance. According to the Overbalance methodology, this hints that the long-term trend remains bearish. Moreover, price dropped back below 100-period EMA, what further supports the bearish outlook.
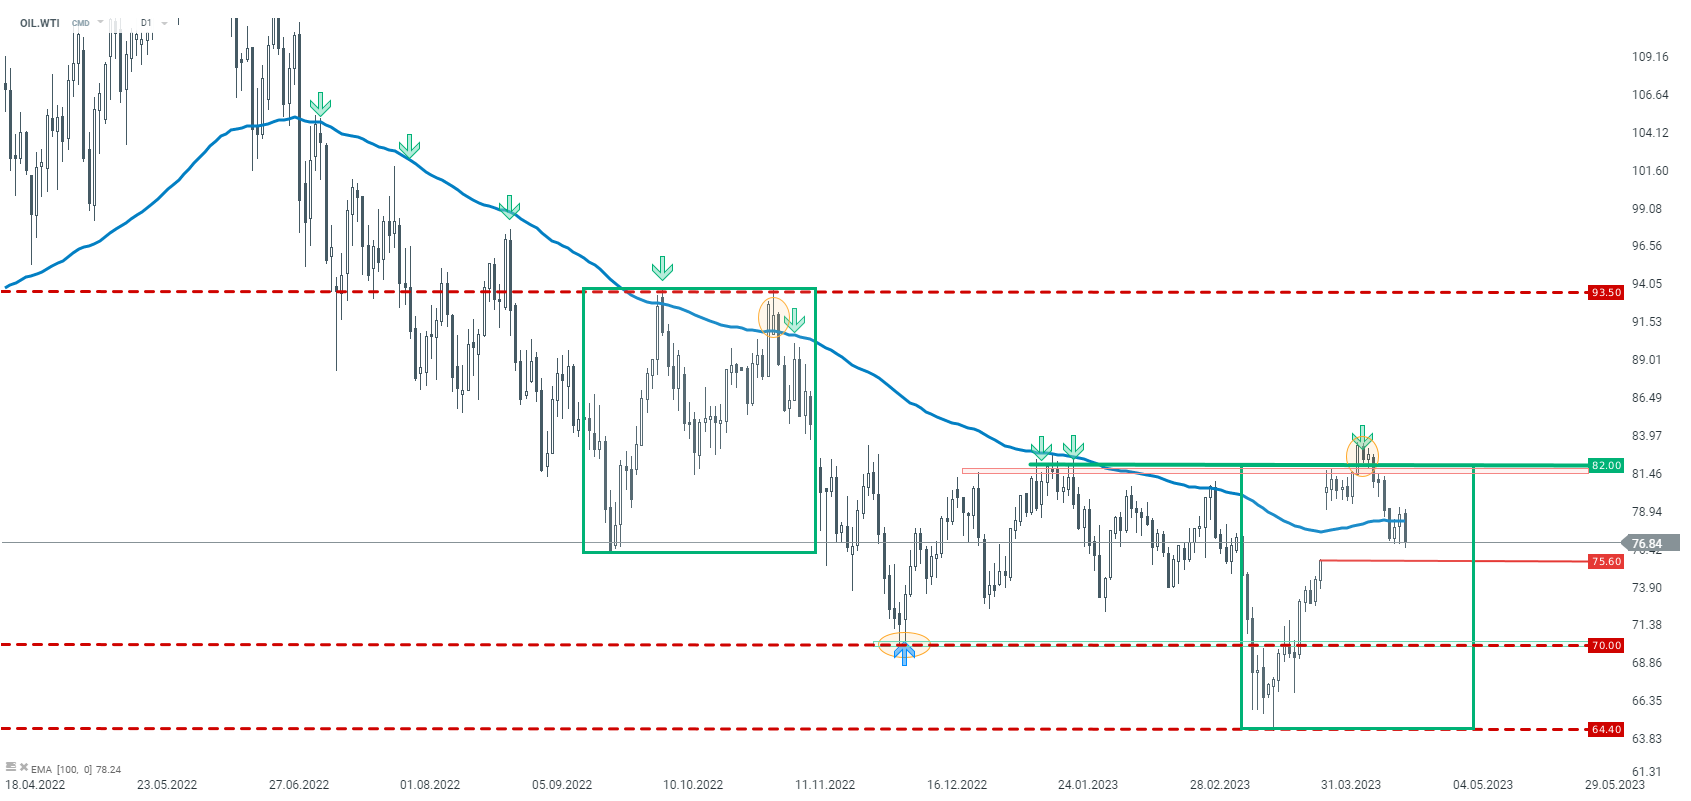 OIL.WTI at D1 interval. Source: xStation5
Taking a look at WTI at a lower interval (H1), we can see that price tested a recently-broken support as a resistance and, after a failure to break above it, downward move was resumed. Currently, we are observing OIL.WTI testing recent local lows in the $76.85 per barrel area and should we see a break below this zone, the way towards $75.50 - lower limit of bullish price gap - will be left open.
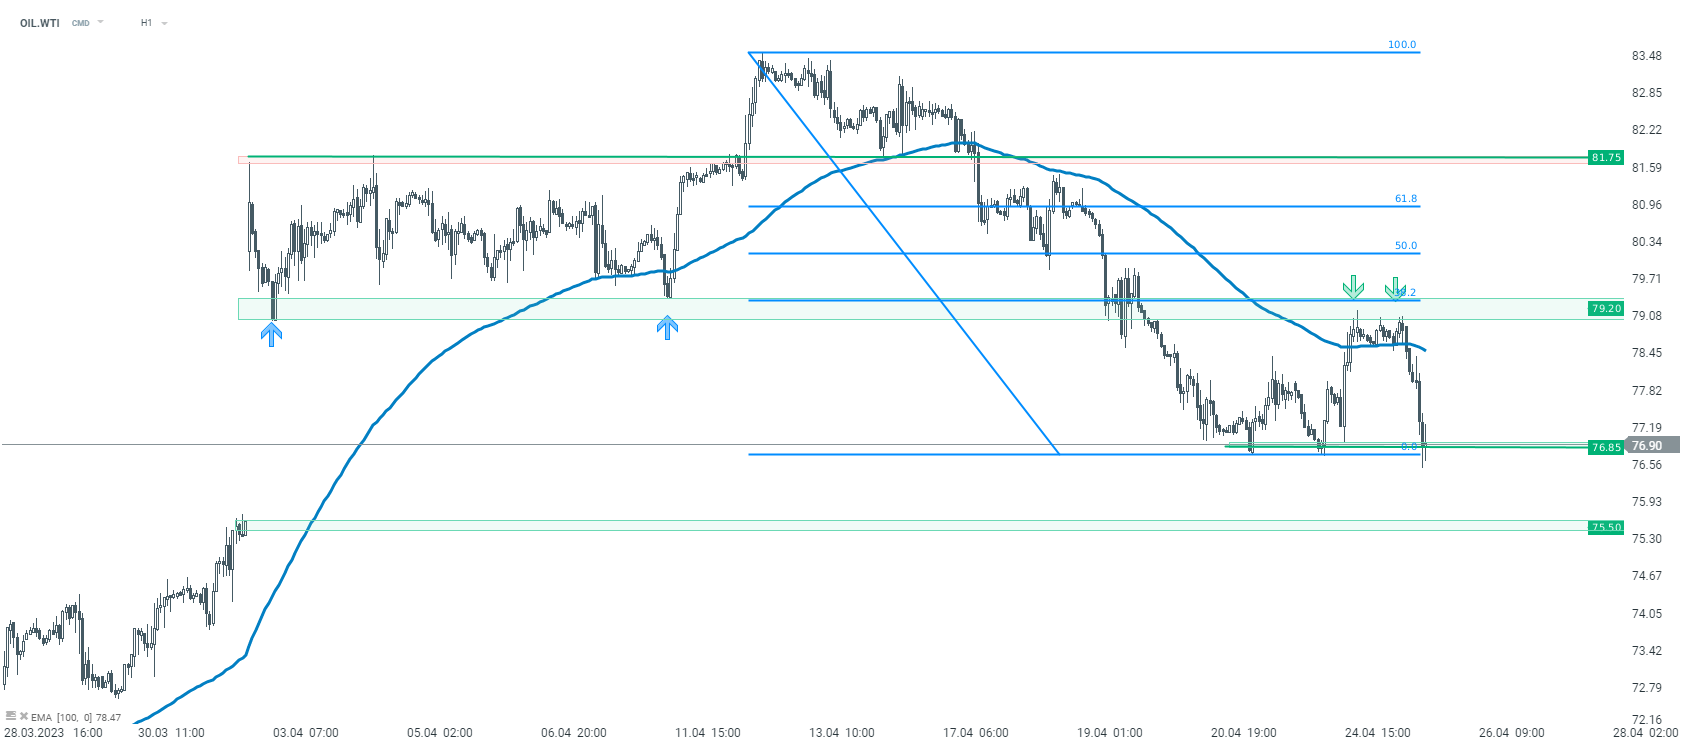
OIL.WTI at H1 interval. Source: xStation5

Daily Summary: Semiconductors Rise in the Shadow of Geopolitical Turmoil

Red Sea, but not the indices : The effects of the Bab al-Mandab blockade.

Silver breaks above $59 and attracts capital again. Gold remains in the shadow of its younger sibling

🛢️Brent crude retreats from $90