



AMD chart (D1 interval)
AMD shares are still trading around 18% below their all-time highs, although they remain roughly 20% above the 200-day EMA, shown by the red line. The broader uptrend therefore remains intact, but momentum has not yet returned. The RSI has cooled and fallen below the neutral 50 level.
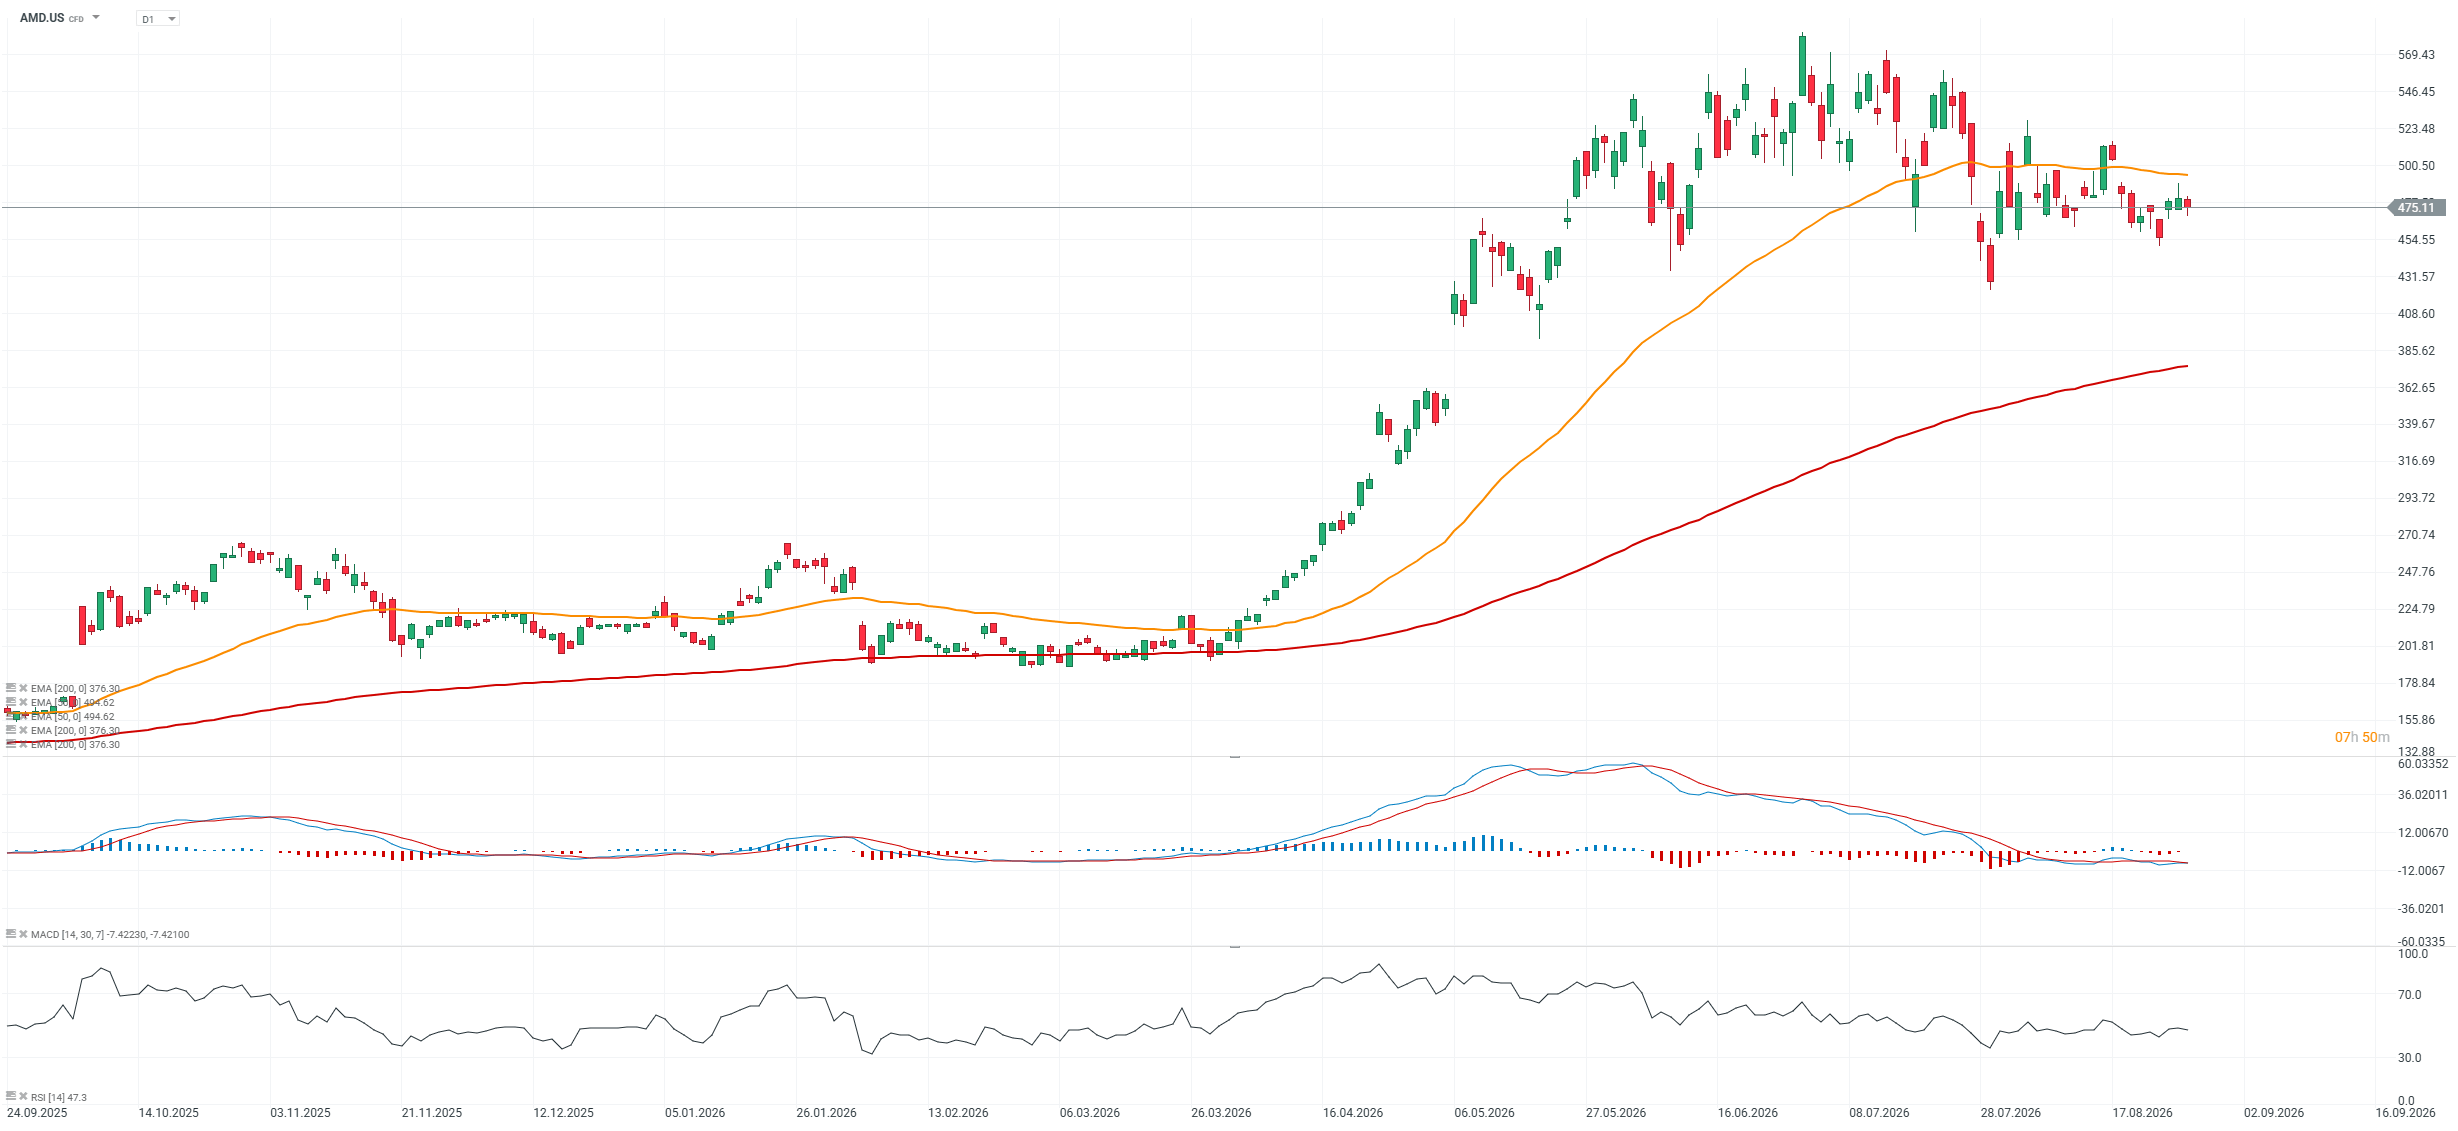
Source: xStation5


🚩 Caterpillar shares extend decline, down 30% from record high


Webull shares down 20% amid fears over potential China ties



US Open: Wall Street in the Red 🚩 Nasdaq Falls 1% From Record Highs, Constellation Brands Back at March 2020 Level



Market Wrap: Oil rises again, French fiscal concerns weigh on euro (07.10.2026)