
Looking at the gold market on H4 interval, one can see that the price is once again testing the key resistance area. The zone marked with a purple colour on the screen below results from the upper limit of 1:1 structure and previous price reactions. According to the classic technical analysis, as long as the price sits below the $1,915, continuation of the downward move looks possible. However, one should keep in mind that the chance of breaking above increases with each subsequent test.
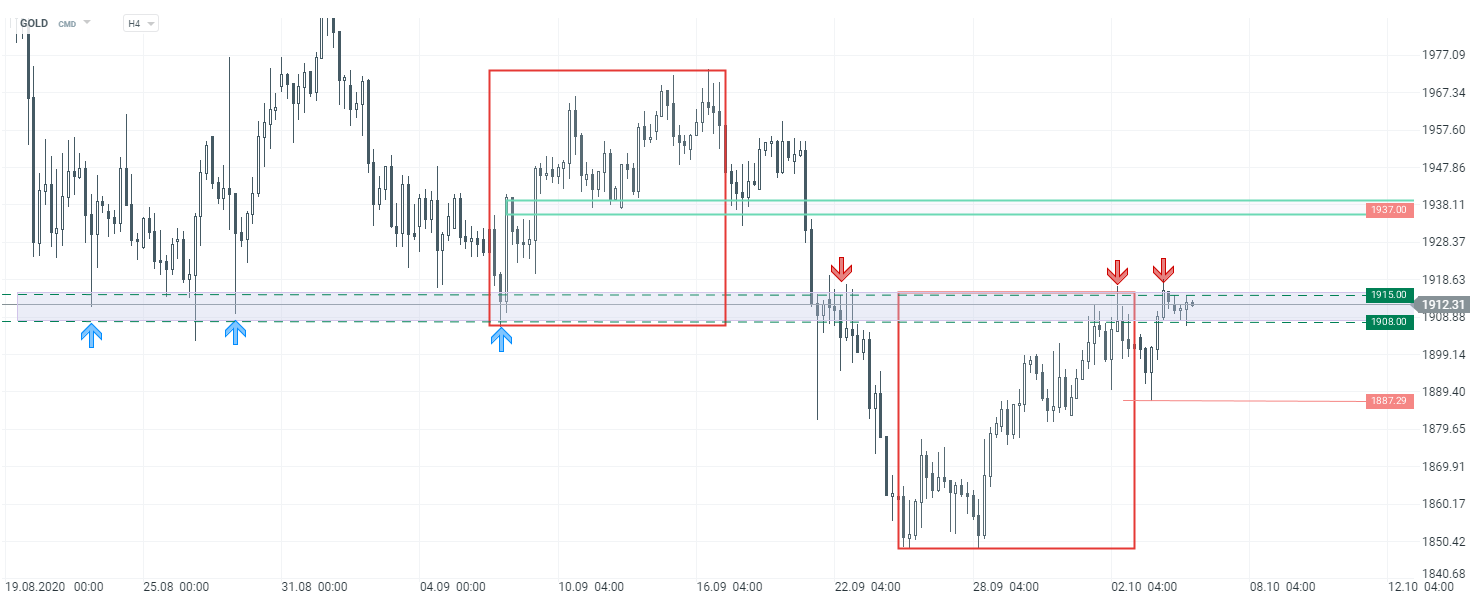 GOLD H4 interval. Source: xStation5

Morning Wrap: The weekend slump in oil prices is accelerating 💥 (27.07.2026)

When will the rise in oil prices reach us?

Daily Summary: Equities Diverge as Tech Lags, Europe Rallies on Earnings & PMIs (24.07.2026)

Three markets to watch next week (24.07.2026)