Summary:
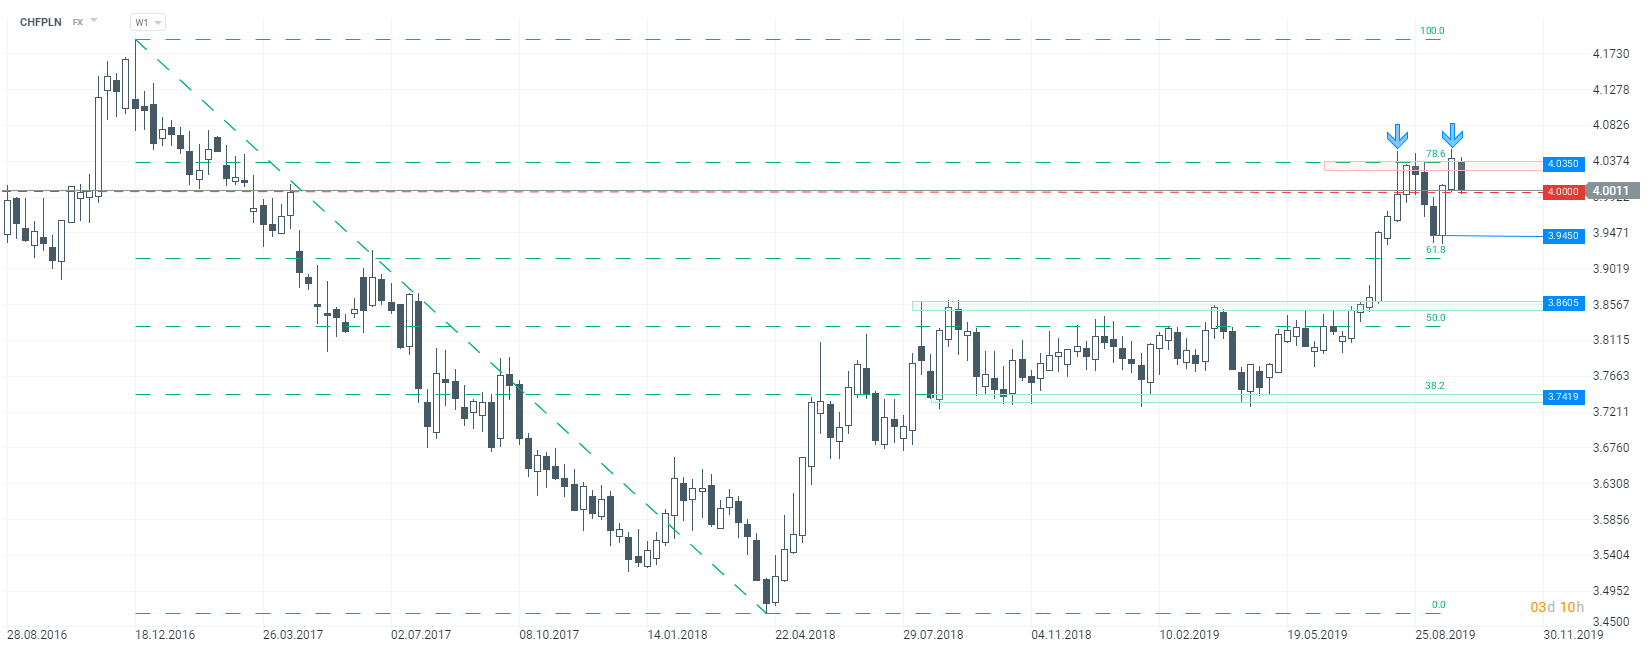
- Local double top formation can be spotted on CHFPLN chart
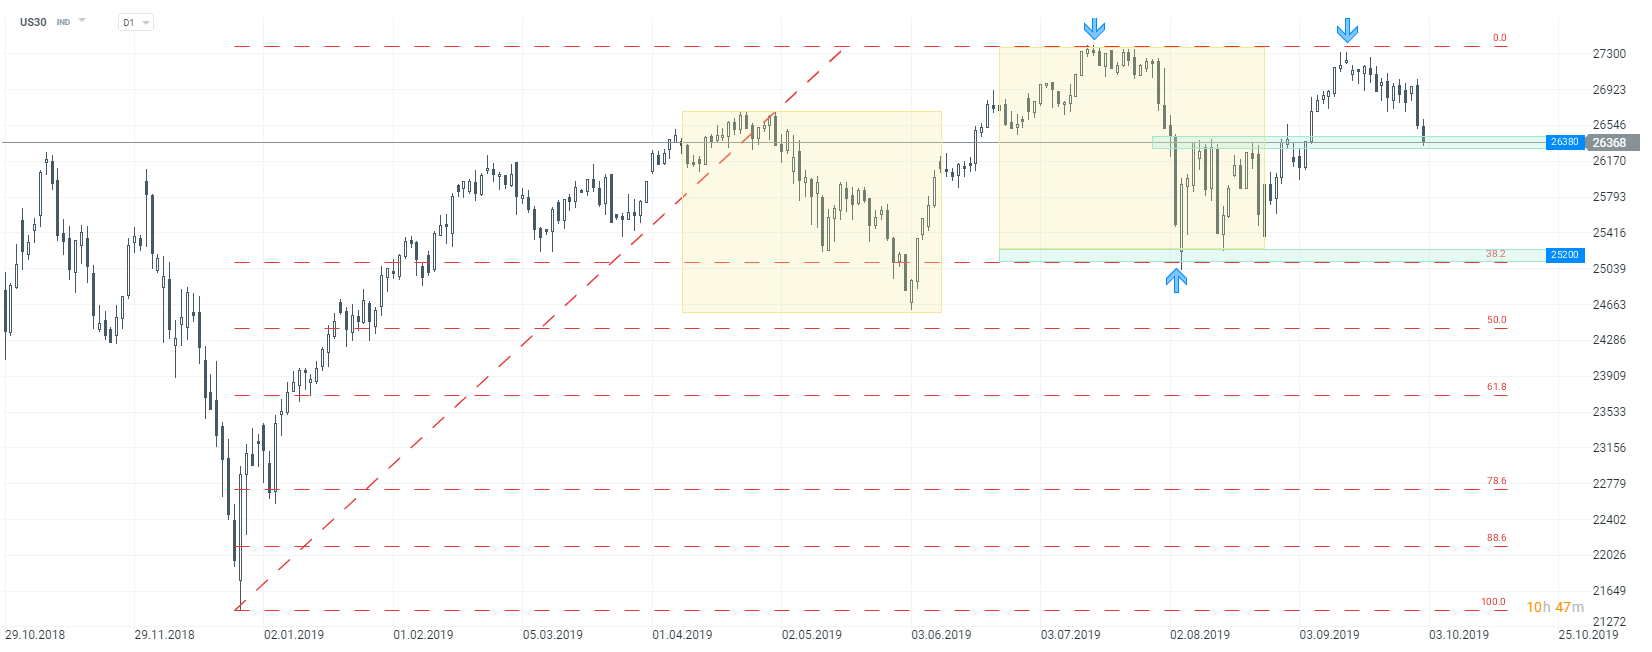
- Declines on stock markets deepen
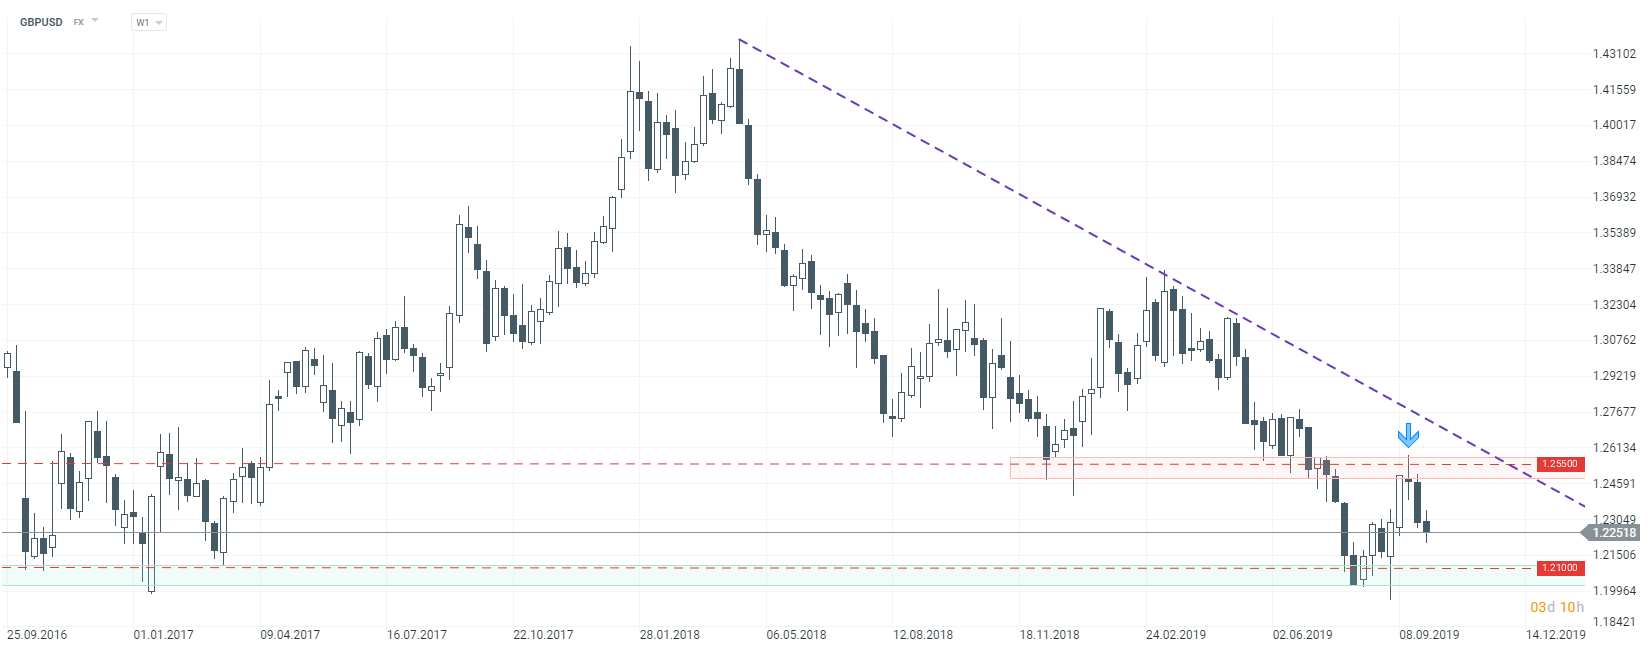
- GBPUSD failed to break above the 1.2550 handle
Let’s start our analysis from GBPUSD chart. Looking at the W1 time frame, one can see that the main trend remains downward. GBPUSD failed to break above the key resistance at 1.2550 handle last week. The last three candlesticks form a bearish pattern - evening star, which heralds a downward move. As long as the price sits under the aforementioned 1.2550 handle, the sellers seem to be favoured by market. In case the current downward sentiment persists, the support at 1.2100 could be in reach. It should also be noted that any news on Brexit may trigger elevated volatility. The deadline for the United Kingdom to leave the bloc is getting closer and closer and the Prime Minister does not look eager to ask for another extension.
 GBPUSD W1 interval. Source: xStation5
Start investing today or test a free demo
Create account Try a demo Download mobile app Download mobile appThe Polish zloty has been under pressure for a few weeks, but it looks like sellers have an advantage on CHFPLN market this week. Potential double top formation can be spotted on the chart. Today’s rate decision of the National Bank of Poland did not have major impact on Polish currency. However, a thing to note is that the EU top court is expected to issue a ruling on FX-mortgages tomorrow and it may significantly affect PLN as well as Polish banking sector shares. Traders should expect elevated volatility on PLN-tied FX pairs tomorrow. A key resistance for CHFPLN can be found at 4.0350 handle, and the nearest support lies at 3.9450 handle.
 CHFPLN W1 interval. Source: xStation5
Last but not least, let's take a look at the US Dow Jones index (US30), where one can observe a steep sell-off. The latest ISM release was the trigger and US indices may be set for a larger downward move. The index failed to break above the resistance near its ATH recently (27300 pts), while moods are poor since mid-September to say the least. US30 is trading at the local support zone (26380 pts area), but break below could pave the way for declines to as low as 25200 pts. On the other hand, given the importance of current price levels, one could expect a bounce once a bullish signal surfaces.
 US30 W1 interval. Source: xStation5

