Two major central banks will announce monetary decisions this week: Fed and ECB. Although the market does not expect changes to the level of rates, investors are looking forward to hints on asset purchases and other recent actions. Fed will announce a decision on Wednesday while ECB's decision is scheduled for Thursday. Let's take a look at the current technical situation on the main currency pair EURUSD, US500 index and gold.
GOLD
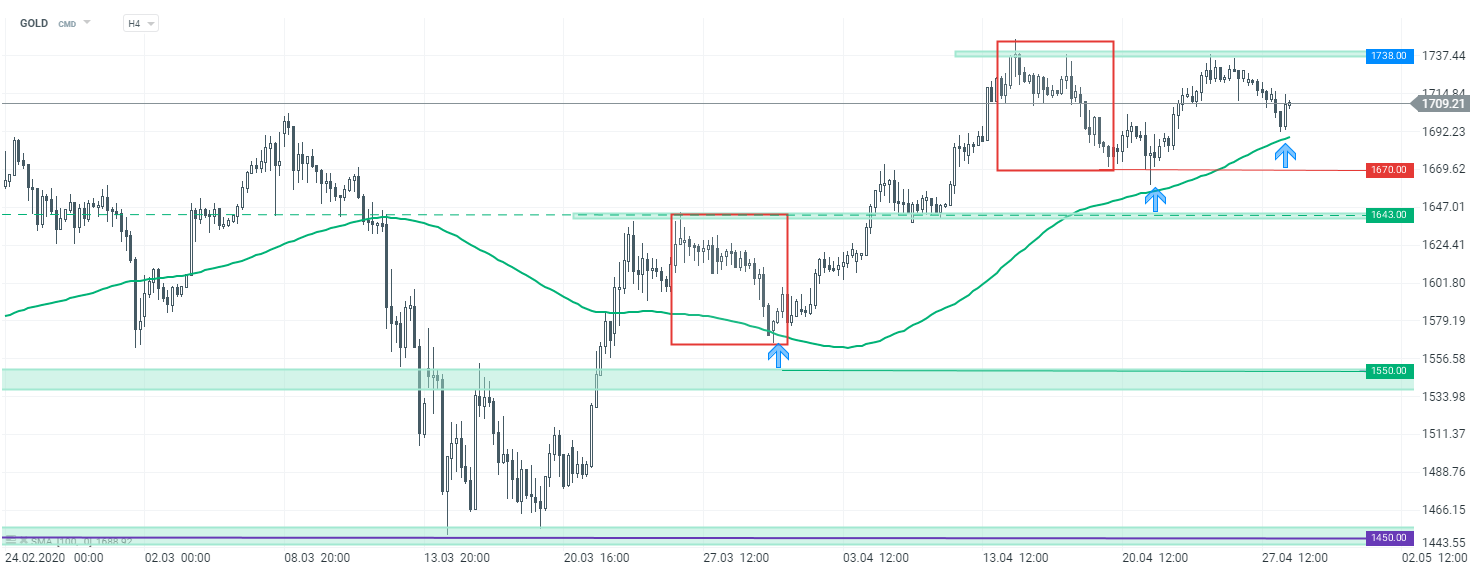
Let’s start with the gold market which has been trading upward recently. Despite the upward sentiment, the price of this precious metal failed to break to fresh YTD high and pulled back from the resistance at $1738 handle. Nevertheless, bulls should not get too concerned unless they see a break below the 100-period moving average (H4 interval, green line on the chart below). In case a break lower occurs, buyers should focus on the $1670 pts handle, where the lower limit of Overbalance structure is located. Last but not least, breaking below $1643 area , marked with previous price reactions, could turn sentiment into bearish and herald a bigger drop.
Start investing today or test a free demo
Create account Try a demo Download mobile app Download mobile app GOLD H4 interval. Source: xStation5
EURUSD
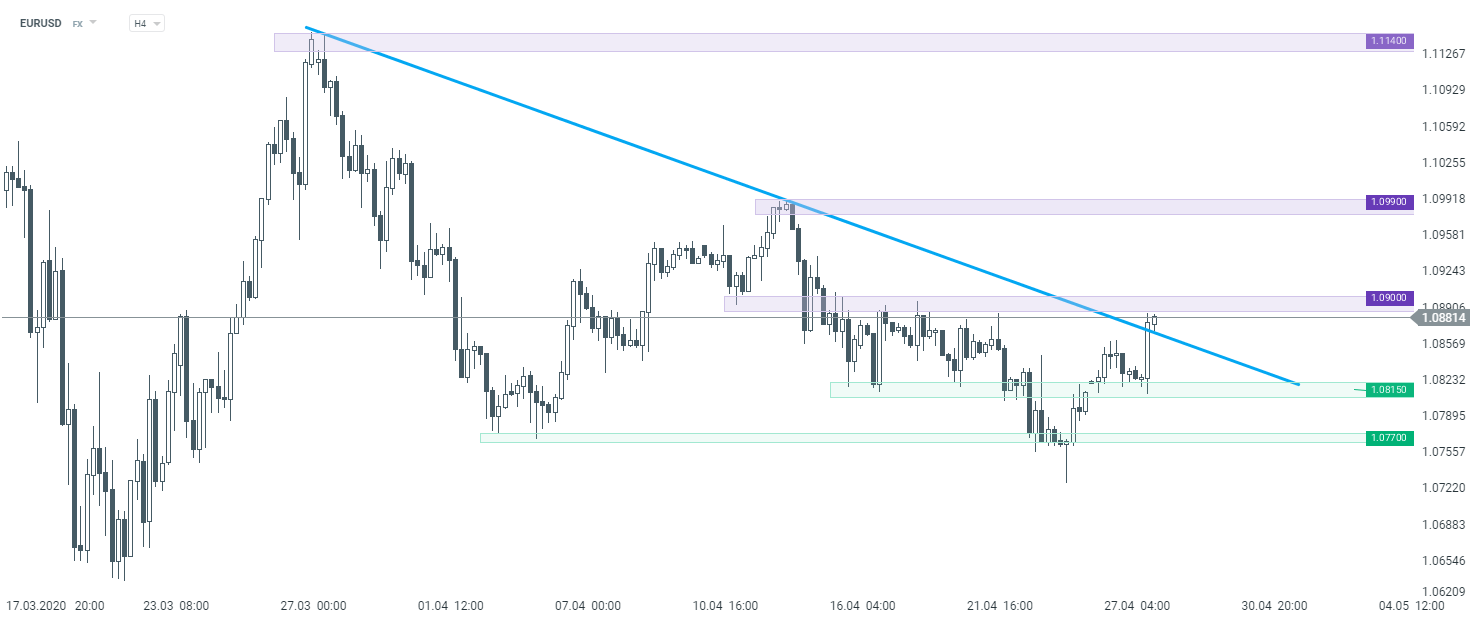
The main currency pair started the week with an upward move. Looking at the H4 interval, one can see that EURUSD broke above the downward trendline, potentially heralding a longer upward move. Nevertheless, to confirm a bullish signal we need to see a break above the resistance area at 1.0900. Should the pair break above it, the way towards the next resistance at 1.0990 will be left open. Recent highs at 1.1140 are the next resistance to watch. On the other hand, should today's bounce fade, support at 1.0815 may be at risk.
 EURUSD H4 interval. Source: xStation5
US500
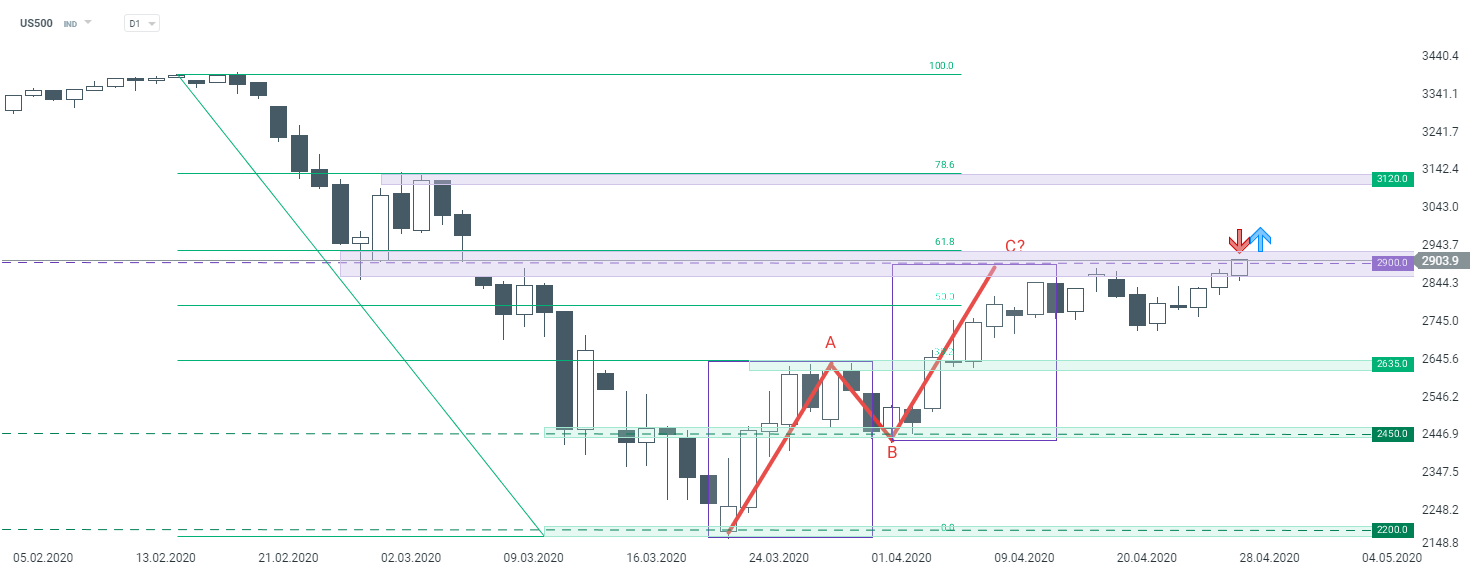
Finally, let’s take a look at S&P500 index (US500). Looking at the daily time frame, one can see that the index is making an upward correction within a downtrend. Recent upward move stopped at the key resistance zone at 2,900 pts. However, the area is being tested once again. The aforementioned zone is marked by equality of A and C waves from the Elliott Wave Theory. Additionally, it is also marked by previous price reactions and 61.8% Fibonacci retracement of the recent downward move. Today's session will be crucial and should determine the direction of the trend over medium-term. As long as the price sits below 2900 pts handle, the downward move looks to be the base case scenario. Nevertheless breaking higher may lead to a bigger upward move with 78.6% Fibo level being potential target (3,125 pts).
 US500 D1 interval. Source: xStation5

