US100
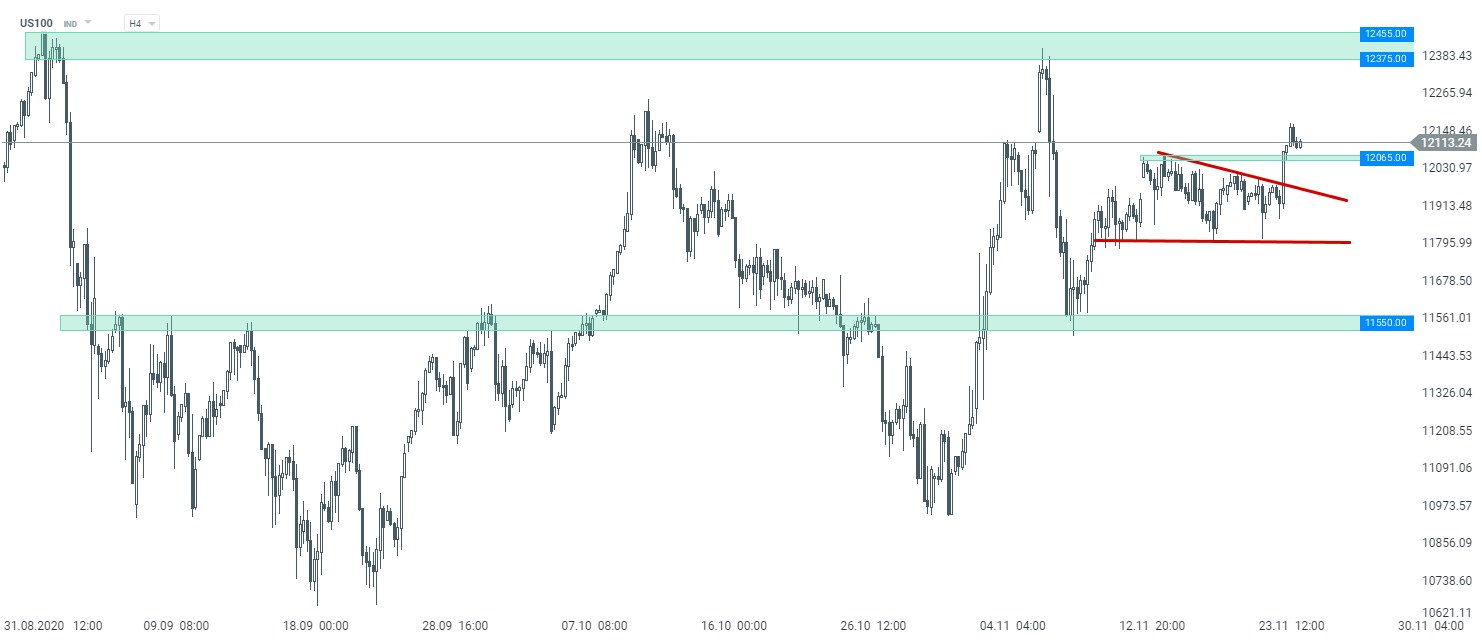
Let's start today's analysis with the US tech index - Nasdaq (US100). Looking at the technical situation, one can see that the price broke above the local consolidation range, signalling a resumption of an upward move. According to classic technical analysis, as long as the price sits above the support at 12,065, a move toward recent records looks to be the base case scenario.On the other hand, should a bigger downward correction start, the nearest key support to watch lies at the 11,550 pts handle.
 US100 H4 interval. Source: xStation5
Start investing today or test a free demo
Create account Try a demo Download mobile app Download mobile appDE30
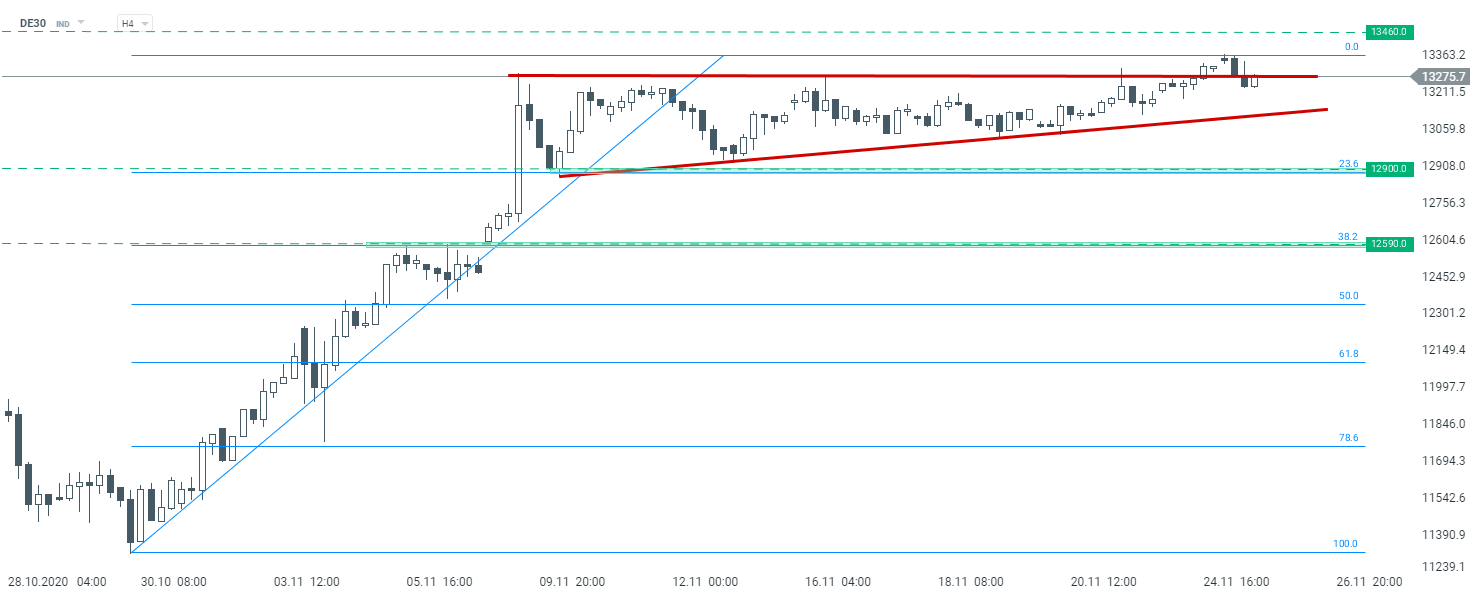
German index has been trading in an upward trend recently. However, upward momentum has clearly slowed down as of late. Looking at the H4 time frame, we can see that DE30 failed to break above the local consolidation range, signaling that the correccion move may be on the cards. Should the price break below the lower limit of the triangle formation marked with red colour, declines could deepen. In such a scenario, the 12,900 pts handle could be the first target for market bears.
 DE30 H4 interval. Source: xStation5
OIL.WTI
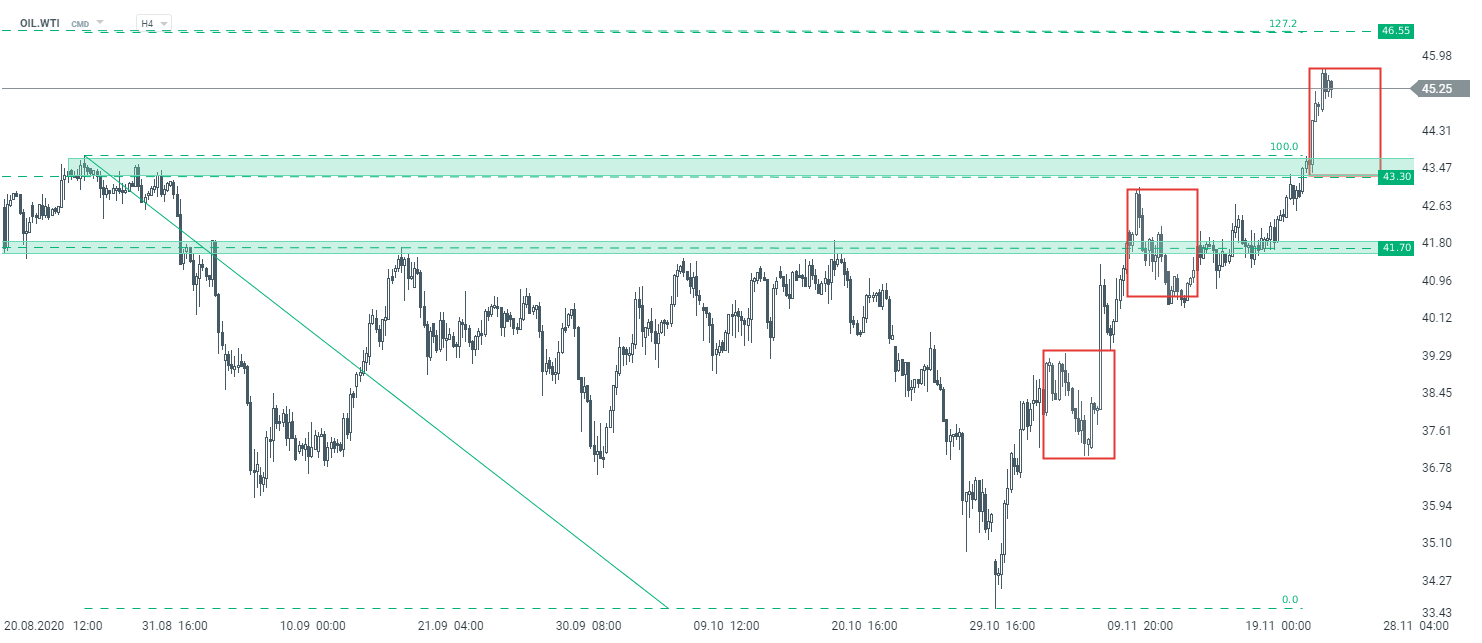
Oil market has been trading in an upward move recently. WTI price (OIL.WTI) broke above the major resistance marked by post-pandemic highs near $43.00. If current sentiment prevails, one could expect a move towards resistance at $46.55, where an exterior Fibonacci retracement (127.2%) can be found. On the other hand, should the downward correction start, the nearest key support to watch lies in the vicinity of the aforementioned $43.00 handle, which is also marked with the lower limit of 1:1 structure.
 OIL.WTI H4 interval. Source: xStation5

