US100
Let's start today's analysis with the US100 chart. Yesterday, the tech-heavy index recorded the biggest one-day drop in over two years, however sellers managed to halt declines around key support at 12000 pts. As long as buyers manage to defend this level, another upward impulse may be launched towards next resistance at 13000 pts, which coincides with 38.2% Fibonacci retracement of the upward wave launched in March 2020. On the other hand, if the bulls capitulate then downward move may extend towards next support at 11200 pts, where June lows are located.
Start investing today or test a free demo
Create account Try a demo Download mobile app Download mobile app
US100, D1 interval. Source: xStation5
SILVER
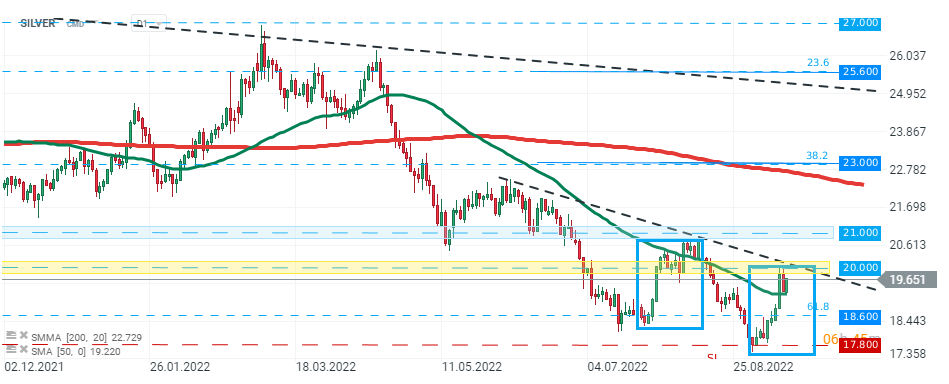
Despite overall negative moods on the markets, silver price remains resilient and managed to erase most of yesterday's losses. Nevertheless as long as price sits below psychological resistance at $20.00 per ounce, the main sentiment remains bearish and further declines towards support at $18.60 per ounce cannot be ruled out. The aforementioned resistance is marked with downward trendline, upper limit of the local 1:1 structure and previous price reactions. However, should a break higher occur, the next resistance to watch lies around $21.00 per ounce.

SILVER, D1 interval. Source: xStation5
ETHEREUM
Finally let's look at the Ethereum chart ahead of "Merge," a highly anticipated upgrade that is expected to be completed around Thursday, September 15th. Prices plunged yesterday as US inflation figures sparked a sell-off of risky assets. Currently price is testing major support zone around $1590, which coincides with 38.2% Fibonacci retracement of the upward correction launched in June and lower limit of the ascending broadening wedge formation. Should break lower occur, the next target for sellers can be found around August lows at $1460. On the other hand, successful "Merge" could bring back optimism on the market and push the price towards resistance at $1760.

Ethereum, H4 interval. Source: xStation5
