USDIDX
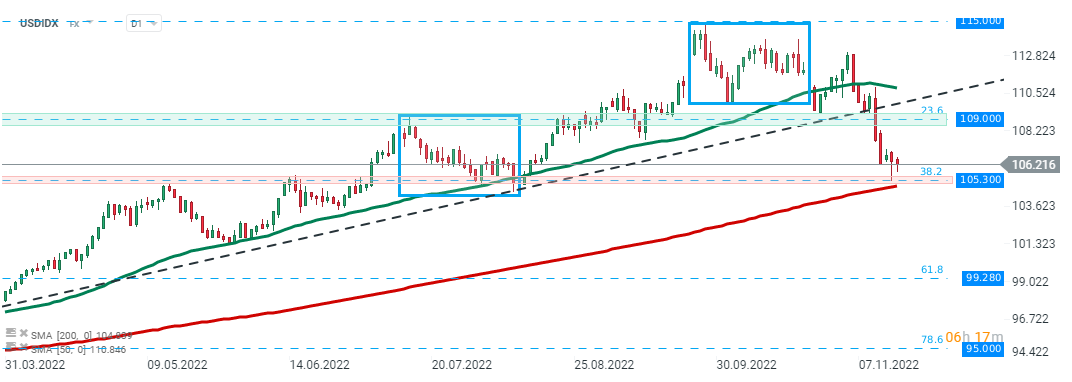
Let’s start our analysis from the USD index chart (USDIDX). One can notice on the D1 interval, we can see that the index continues to move lower following an earlier break below the lower limit of a market geometry and the upward trendline. Nevertheless sellers struggle to break below key support zone in the 105.00 area, which is marked with 38.2% retracement of the upward move launched at the beginning of 2021 as well as previous price reactions and 200-session moving average.
 USDIDX, D1 interval. Source: xStation5
BITCOIN
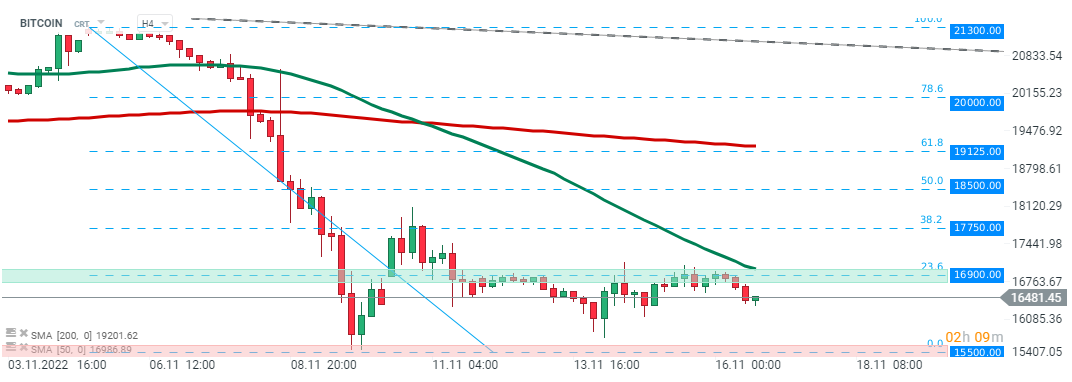
Taking a look at the Bitcoin chart at the H4 interval, we can see that the cryptocurrency recently bounced off major resistance at $16900, which coincides with 23.6% Fibonacci retracement of the last downward wave and 50 SMA (green line). As long as the price sits below, this level, retest of recent lows at $15500 cannot be ruled out.
 BITCOIN, D1 interval. Source: xStation5
SILVER
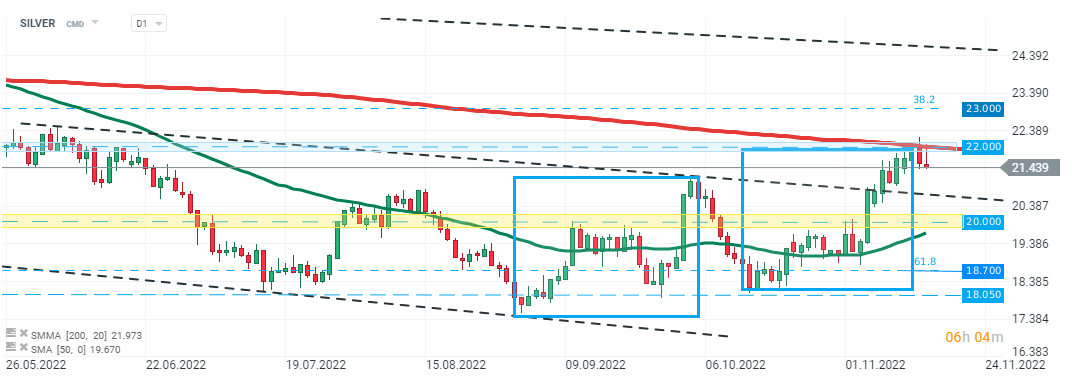
Last but not least, let’s take a look at the silver market. Taking a look at the precious metal from a broader perspective, one can see that the price bounced off a key long-term resistance at $22,00, which is marked with upper limit of the 1:1 structure and 200 SMA (red line). Such price reactions may signal a potential bigger downward correction. Considering such a scenario, the key support to watch can be found at $20.00, which is marked with previous price reactions. On the other hand, if buyers manage to break above the aforementioned $22,00 resistance the way towards $23.00 will be left open.
 SILVER, D1 interval. Source: xStation5
Amazon gains almost 10% after earnings report 📈US100 tries to recover
Daily Summary: ECB, FOMC and MAG7 - mixed signals and risk aversion
US OPEN: Powell, MAG7 and Trump mix market's sentiment
BREAKING: EIA gas inventories change slightly above expectations. NATGAS increase after EIA data 📌


