Bitcoin
Let’s start today’s analysis with the Bitcoin market. Most famous cryptocurrency has been trading in a strong downward trend recently. Looking at the daily interval, we can see that Bitcoin launched a local upward correction, following a bullish candlestick pattern - bullish engulfing. Should the short - term upward sentiment prevail, the upward correction towards $25,000 is possible. This resistance is marked with previous low from 12th of May and the upper limit of 1:1 structure. However, according to the Overbalance methodology, as long as the price sits below $25,000 resistance, the main trend is downward. The nearest support is located at recent low - $18,000, where the exterior 127.2% Fibonacci retracement is located. Breaking below this support may herald a bigger downward move towards $12,250.Bitcoin D1 interval. Source: xStation5
Start investing today or test a free demo
Create account Try a demo Download mobile app Download mobile appOIL.WTI
Next, let's take a look at the oil market. Analyzing the chart on the H4 interval, one can see that the price has plunged recently. The price broke below the lower limit of the smaller 1:1 structure marked with blue color, which may herald a continuation of downward move. According to the Overbalance methodology, the move towards a lower limit of a bigger 1:1 structure at $100.00 is possible now. It is also a psychological level which should turn out to be a significant support. Breaking below can lead to an even bigger sell-off. On the other hand, the $106.50 area should be considered as the nearest resistance.
US2000
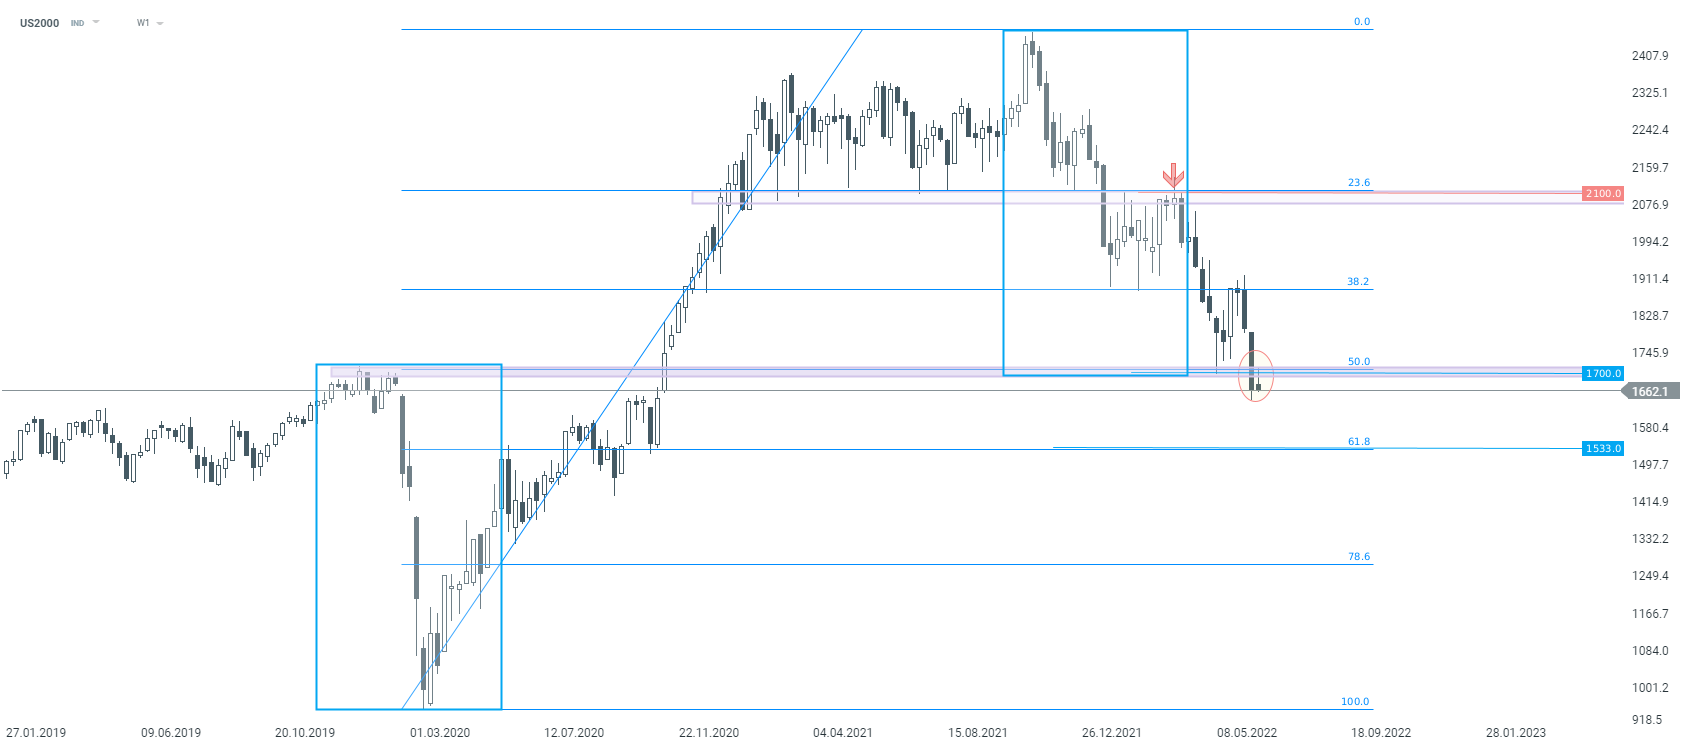
Last but not least, let’s take a look at the US index - Russell 2000 (US2000). Looking at the H4 interval, one can see that the index has been trading in a downward trend for months. The first bears' attack on the key support at 1,700 pts was repulsed but sellers managed to push the price below it on a second attempt, which may herald a continuation of downward trend. The aforementioned area at 1,700 pts is marked with lower limit of the wide 1:1 structure, previous price reactions, as well as 50% Fibonacci retracement of the recent upward impulse started in March 2020. According to the classic technical analysis, continuation of the downward move is possible. On the other hand, should the price return above the aforementioned support at 1,700 pts, the upward correction may be launched.
 US2000 W1 interval. Source: xStation5

