
The beginning of the new month brought a deepening decline in the stock market. However, it should be noted that the contract based on the S&P500 (US500) has reached a key medium-term support level where buyers have appeared. We are talking about the level of 4235 points, which results not only from the upper limit of the upward channel but also from the broad geometry of 1:1. If this support is successfully defended, according to the Overbalance methodology, it will be possible to generate another upward wave. Otherwise, a price breakdown below this point may trigger a stronger downward move and even lead to a change in trend to a bearish one.
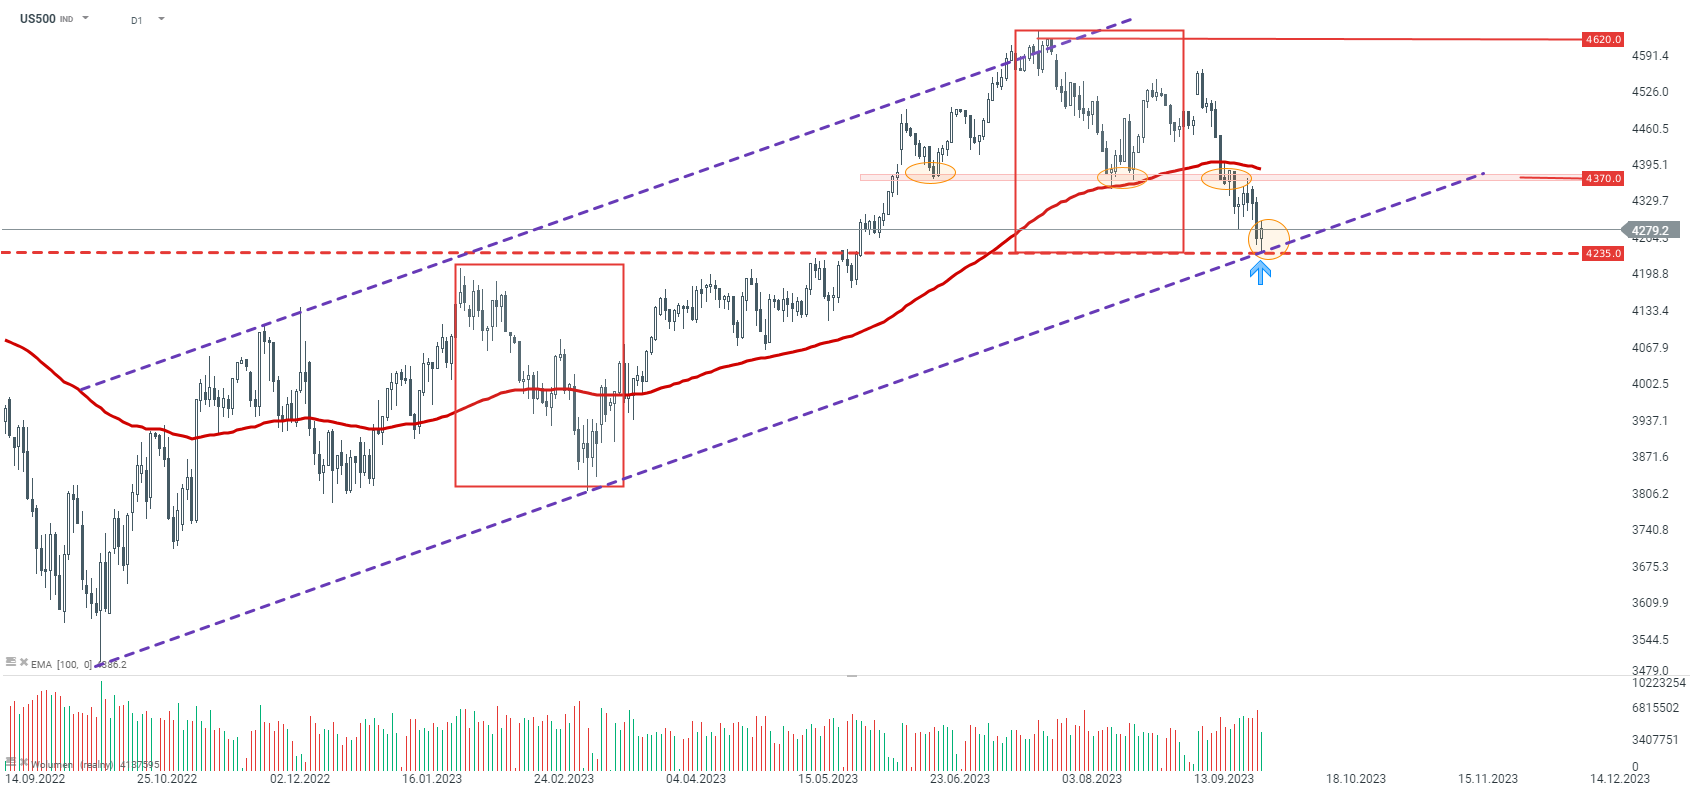
Source: xStation 5
Looking at a shorter time frame - H1, the index remains in a downward trend. The key short-term resistance is currently the tested zone around 4280 points. If it were to be surpassed, the next significant level would be 4330 points, which corresponds to the previous upward correction. If that too was surpassed, the next resistance falls around 4365 points, resulting from earlier local peaks and measuring 38.2% of the last downward wave. It seems that only its negation could lead to a change in sentiment to bullish.
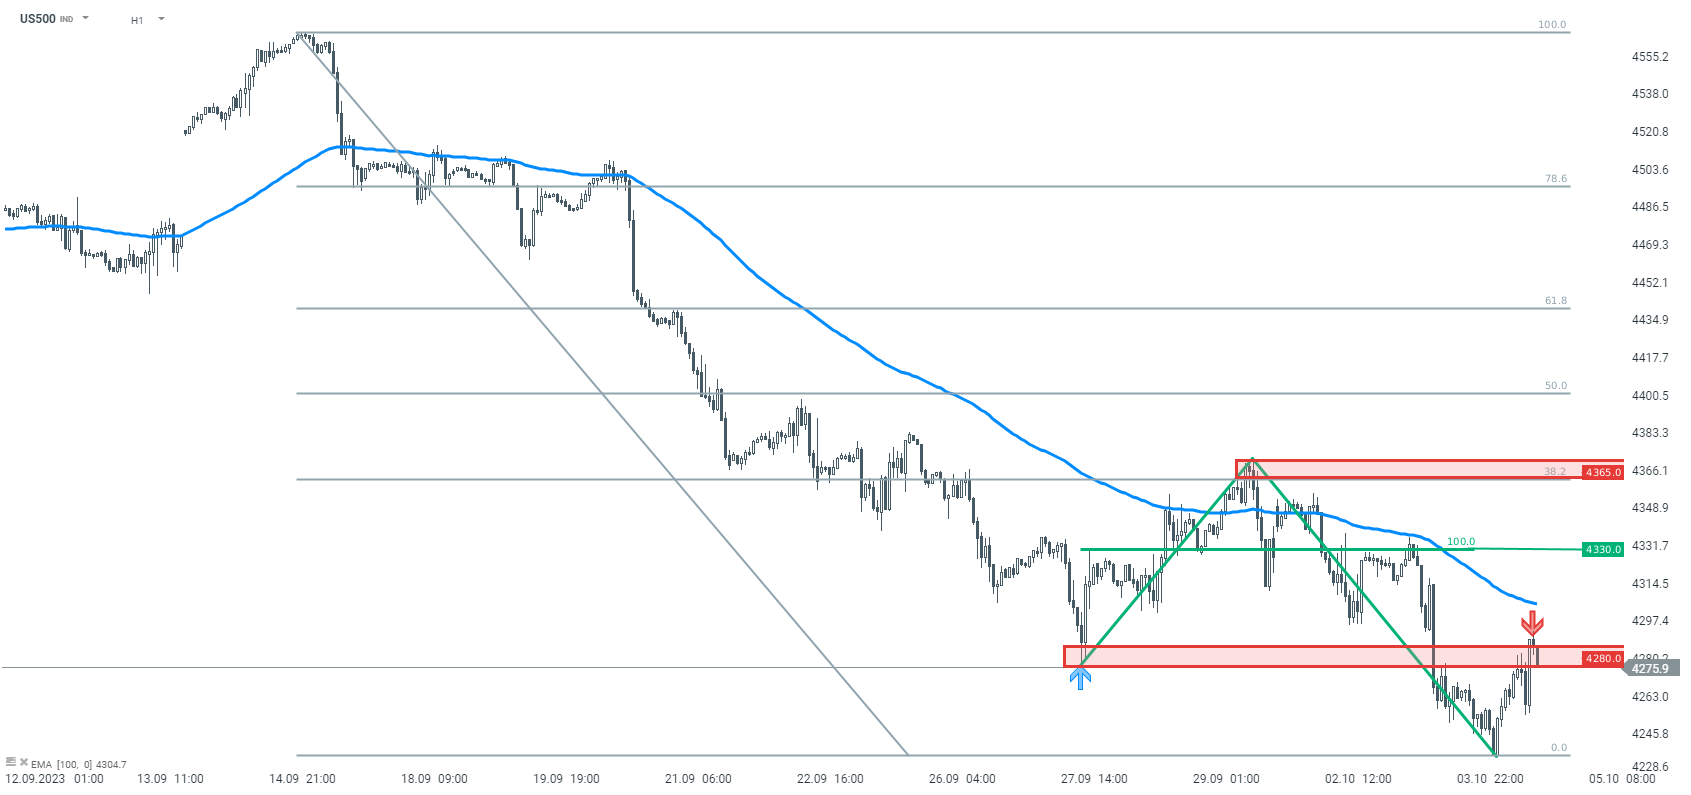
Source: xStation 5

US Open: Blood on Wall Street as Semiconductor Sector Extends Correction

Chart of the day: Nasdaq futures dip 0.6% despite TSMC earnings beat! AI sanity check? (16.07.2026)

Economic Calendar: Earnings, US Retail Sales and Fed to Fight for Investors' Attention (16.07.2026)

Morning Wrap: Asia dips on US semiconductor sell-off. All eyes on TSMC (16.07.2026)