
Markets did not expect increased geopolitical tensions, deglobalisation trends, problems in supply chains and inflation to change sentiment toward energy companies. The global trend toward zero-carbon and green energy sources has also become an additional driver of positive change for the energy sector. The global energy crisis is not just rising gas or electricity prices driving inflation. It's also changing revenue expectations for companies operating in the market, from electricity or LNG suppliers to uranium producers to electric car companies. In this article below, we will identify ways, listed companies and financial instruments that can respond to improving sentiment toward the energy industry. So let's take a closer look at how to invest in electricity and power?
Markets did not expect increased geopolitical tensions, deglobalisation trends, problems in supply chains and inflation to change sentiment toward energy companies. The global trend toward zero-carbon and green energy sources has also become an additional driver of positive change for the energy sector. The global energy crisis is not just rising gas or electricity prices driving inflation. It's also changing revenue expectations for companies operating in the market, from electricity or LNG suppliers to uranium producers to electric car companies. In this article below, we will identify ways, listed companies and financial instruments that can respond to improving sentiment toward the energy industry. So let's take a closer look at how to invest in electricity and power?
How to invest in electricity and power?
Investors look for rates of return under all conditions, including when the stock market is mired in uncertainty, indexes are losing and energy commodity prices are climbing higher with inflation. However, a decline in one trend is usually an increase in another, and the energy industry still seems 'crisis-proof' amid rising inflation. It is thanks to rising energy commodity prices and the improving financial performance of energy companies that investors have begun to see the sector as a 'safe haven' in 2022. When we look at the S&P 500 index we can see that companies from almost every sector have scored sell-offs this year, except energy companies.
Energy prices are being driven strongly by supply and cost concerns. Companies can count on additional 'headwinds' in the form of global pro-climate trends that put them above 'old economy' companies. The war in Ukraine and energy issues have meant that while the energy transition is still on the table, even 'old-economy' companies operating in the natural gas and oil markets are boosting earnings.
Also, investors who expect a decrease in global tensions and the return of euphoric sentiment have changed perceptions around energy companies. They have begun to be part of a diversified portfolio designed to hedge against the risk of deeper declines or rising energy prices.
Ok, but how?
Moving on to the most important question - investing in energy market and energy trading is possible through:
- Stocks of listed companies and ETFs
- CFD, leveraged financial instruments
In the following part of the article we will focus on each of these instruments, pointing out their characteristics and examples of companies in the energy sector.
The pendulum Effect
 Like legendary Wall Street distressed debt investor and OakTree Capital co-founder Howard Marks tells, in normal life people's moods are usually moving between not very good and not very bad. But the market pendulum moves from flawless to hopeless. Energy and commodity markets were oversold for years and investors have preferred other segments like technology or financial services. But still energy is fuel for the global economy and its role is crucial. In the face of the 2022 energy crisis global investors understood it finally by appreciating the role of the S & P 500 Energy Index. Energy companies' stock prices boomed. But the pendulum is still on the move. Investors' role is to recognise where it is going.
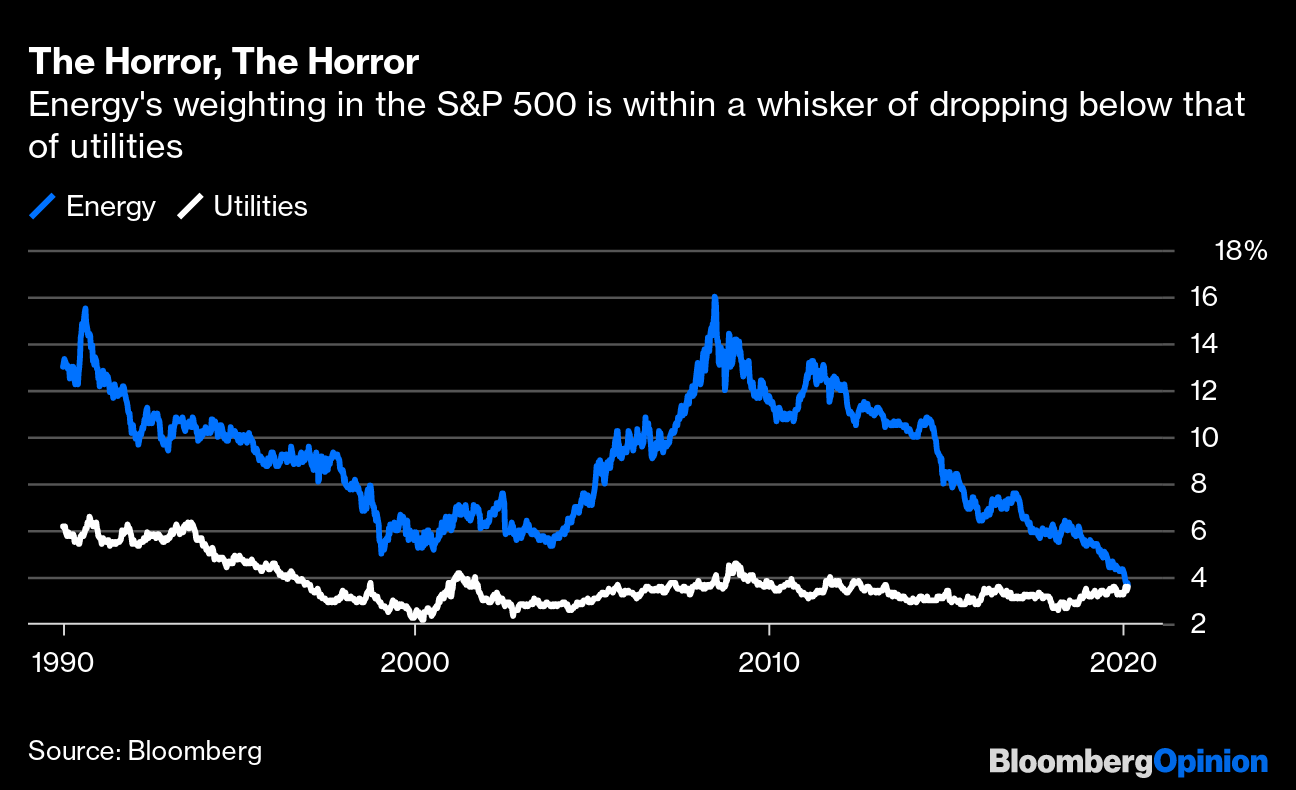
Chart: The charts below show how market sentiment and revenue perceptions of companies operating in the energy market have changed over time.
This chart shows that during the last three decades energy markets were in a cyclical, 10 year trend with 1990 and 2010 highs and double bottoms at 2000 and 2020 period. In the last 10 years investors have underestimated energy stocks, the S & P Energy index achieved a final bottom in the face off Covid-19 market crash.
Source: Bloomberg
 Please be aware that information and research based on historical data or performance does not guarantee future performance or results. Past performance is not necessarily indicative of future results, and any person acting on this information does so entirely at their own risk.
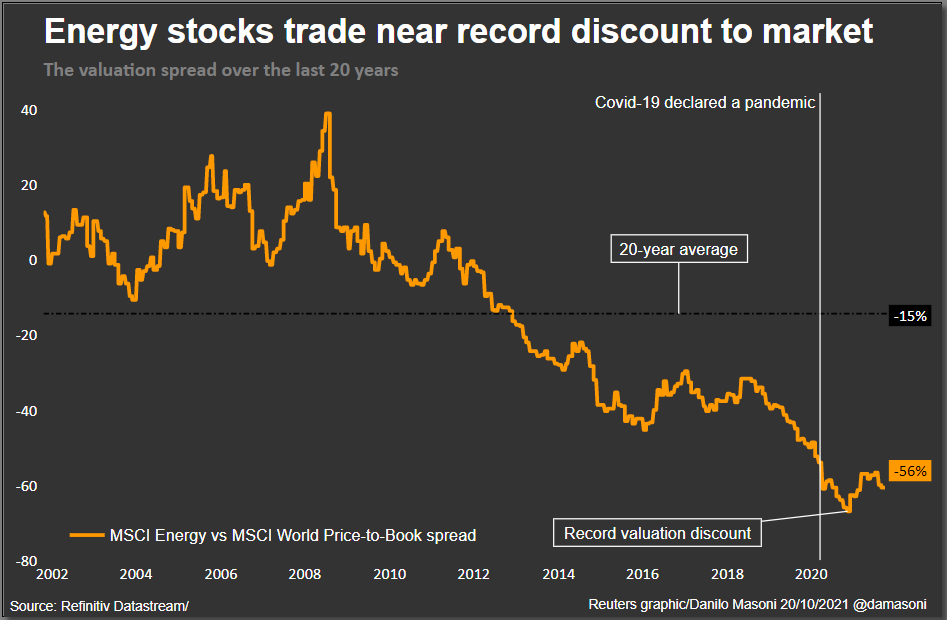
Chart: Price to book ratio spread between MSCI Energy vs MSCI World during covid lows achieved record valuation discount. Energy stock companies were the first victim of pandemic shocks.
 Please be aware that information and research based on historical data or performance does not guarantee future performance or results. Past performance is not necessarily indicative of future results, and any person acting on this information does so entirely at their own risk.
Chart: The situation changed in the 2021 period when energy stocks due to ‘green transformation’ global efforts outperformed every S&P Index except technology stocks. Bullish momentum came on the energy market and in 2022 is still there despite indices falling.
Source: The Motley Fool
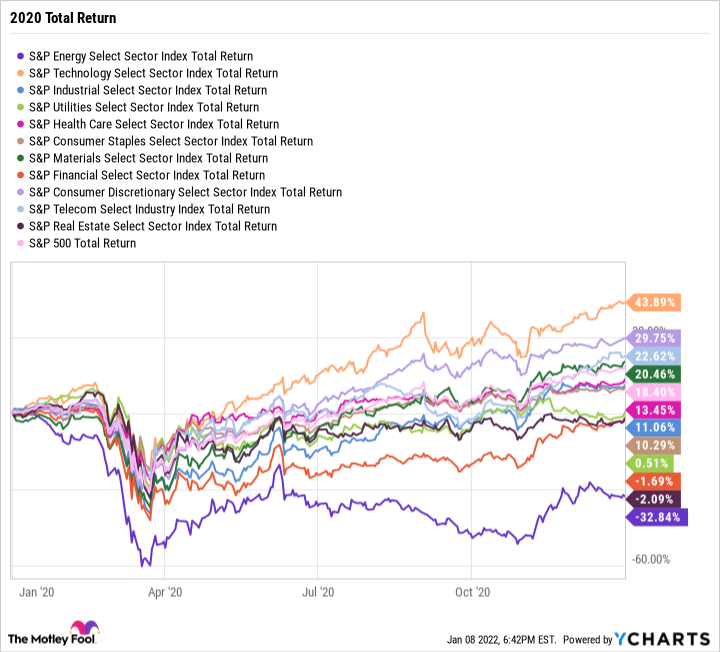
Chart: Energy paradigm shift and perception of expected future revenues of energy companies made energy companies outperformed S&P 500 average and left all other sectors behind.
Source: Bloomberg
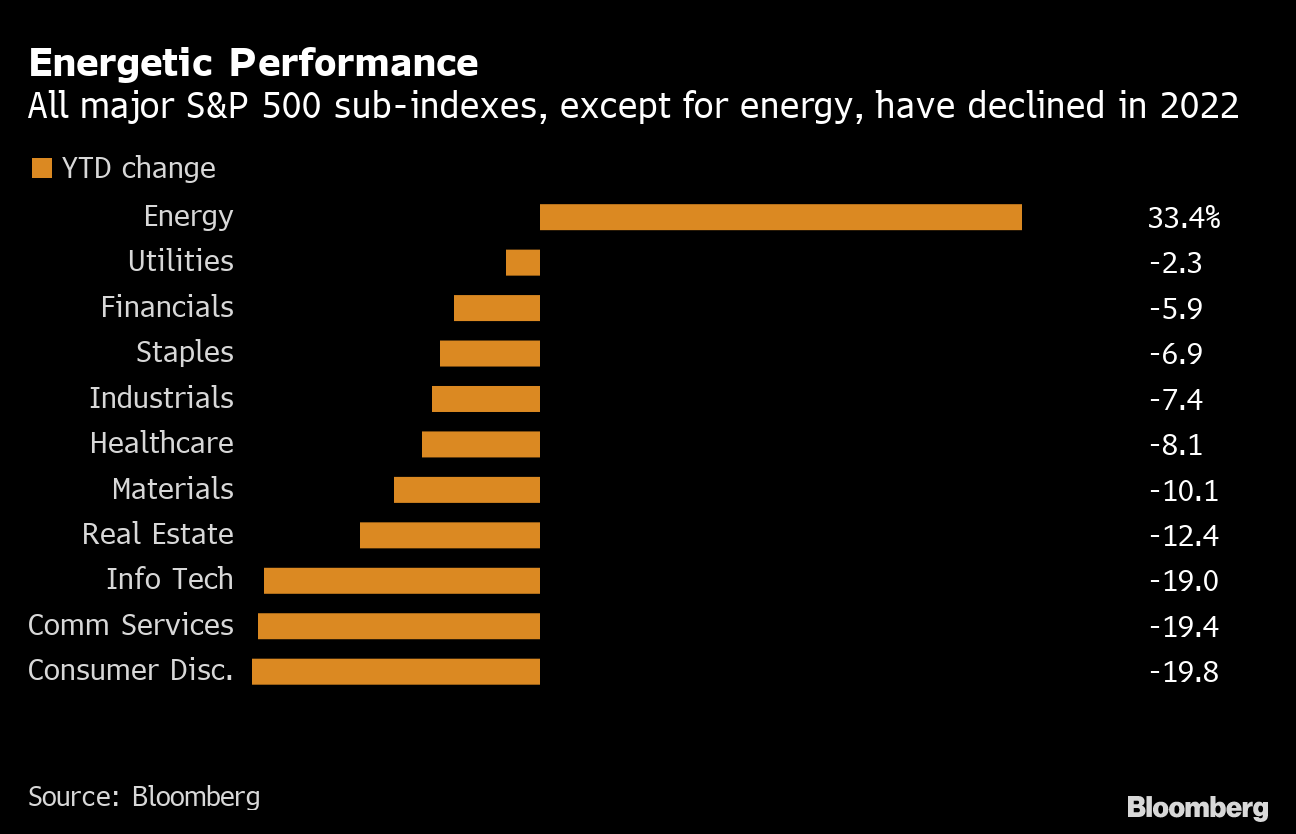
Chart: Now, in the face of Russia - Ukraine war, global energy supply shocks, supply chain bottlenecks and global energy transformation still on the table we can see great transformation in market sentiment to the Energy S&P 500 companies sector, which gained weight in S&P 500 over 5%. We can also see correlation with rising inflation and crude oil prices. Despite bullish divergence with other US stocks, the market pendulum is always worth remembering.
Chart: 2022 S&P Energy bullish divergence with NASDAQ 100, S&P500 and Dow Jones.
Source: Refinitiv
Energy related Stocks and ETFs
One way to invest in electricity and power is of course, through exposure to the stock market through listed companies operating in the energy sector. A related investment option to the stock market are ETFs, which offer greater diversification and relatively lower volatility due to the broader portfolio of companies listed within the selected fund. Depending on the ETF, there can be anywhere from a few to as many as dozens of stocks of listed companies in the selected sector.
Stocks
- Energy infrastructure: Halliburton (HAL.US), EQT Corp (EQT.US), Brookfield (BAM.US), Atlantica Sustainable Infrastructure (AY.US), Kinder Morgan (KMI.US)
- Energy storage: Diamondback Energy (FANG.US), Williams Companies (WMB.US)
- Energy Utilities: E.ON (EDAN.DE), Electricite de France (EFR.FR), NiSource (NI.US), AES Corp (AES.US), Exelon (EXC.US), Dominion Energy (D.US), Devon Energy (DEVN.US)
- Hydrocarbon: Coterra Energy (CTRA.US) Conocophillips (COP.US), Hess Corp (HES.US), Ovintiv (OVV.US)
- Natural Gas: Cheniere (LNG.US), Targa Resources (TRGP.US), Oneok (OKE.US), Antero (AR.US), Tellurian (TELL.US), Williams Companies (WMB.US), Clean Energy Fuels (CLNE.US)
- Uranium producers: Uranium Energy Corp (UEC.US), Cameco (CCJ.US), Energy Fuels (UUU.US), Kazatomprom (KAP.UK)
- Wind energy: Vestas (VWS.DK) NextEra Energy (NEE.US), Brookfield (BAM.US), Orsted (ORSTED.DK)
- Hydrogen stocks: PlugPower (PLUG.US), FuelCell (FCEL.US), Bloom Energy (BE.US), Nel (NEL.NO)
- Solar energy stocks: FirstSolar (FSLR.US), SunWorks (SUNW.US) , Sunrun (RUN.US), Sunpower (SPWR.US), Enphase Energy (ENPH.US) SolarEdge (SEDG.US), Maxeon Solar Technology (MAXN.US), Encavis (ECV.DE), Columbus Energy (CLC.PL), Suntech (SUN.PL)
- Electric vehicle and battery producers: Tesla (TSLA.US), Rivian (RVN.US), Nikola (NKLA.US), NIO (NIO.US), Albemarle (ALB.US), Quantumscape (QS.US)
ETFs
- Invesco Global Clean Energy UCITS ETF (GCLX.UK)
- iShares Global Clean Energy UCITS ETF (IQQH.DE)
- Invesco Solar Energy UCITS ETF (RAYS.UK)
- xTrackers MSCI World Energy UCITS ETF (XDW0.DE)
- L&G Hydrogen Economy (HDW0.DE)
- Global X Uranium UCITS ETF (URNU.DE)
Some of the companies in the energy sector also share their profits with shareholders by paying out dividends, such as E.ON (EDAN.DE) or Kinder Morgan (KMI.US), which operates more than 130 000 km of pipelines in the USA.
Investing in classic stocks and ETFs is most often used by medium and long-term investors, such investors often preferring a 'buy and hold' strategy. Of course, some traders use them for short-term speculation in order not to expose themselves to higher leverage risks.
CFD Stocks and ETFs
Shares of some companies and ETFs are also available in the form of leveraged financial instruments with the notation CFD 'contract for differences'. Derivatives are most often used by short-term investors trying to take advantage of dynamic, fast market movements and increased volatility. Leverage makes it possible to achieve a higher return in a relatively shorter period of time, but comes with a high degree of risk. Consequently, the loss incurred by CFD traders is also greater. Leverage in the case of shares or ETFs allows you to buy more shares or fund units.
For a simple example, an investor who wants to buy $1,000 worth of Kinder Morgan shares can buy 100 of them assuming each share is worth $10. However, if he uses a leverage of 1:2, he will be able to buy 200 shares for the same amount, US$1,000. Changes in the price of a leveraged instrument are more noticeable to the trader's portfolio and, in extreme cases, cause a total loss of margin.
However, before you get into derivatives speculation, we encourage you to read up and familiarise yourself with key terms like 'Margin stop' and 'Margin level', which are essential for any trader starting a risky trade.
NATGAS and EMISS trading
 At xStation5, there are several ways to trade leveraged derivatives that correlate or depend in part on energy prices. These include CFD instruments:
- CO2 emissions contracts - EMISS
- Natural gas prices - NATGAS
EMISS and NATGAS trading is available on the XTB trading platform. There you can start energy trading by entering into CFD (contract for differences) transactions on the EMISS instrument and use the financial leverage.
By trading CFD contracts you can take advantage of market volatility and open positions during very fast price movements. Leverage is very risky. It can make a complete margin loss but it can also multiply trader's profits. Trading CFDs on EMISS or NATGAS instruments is dedicated to active traders who are familiar with risk and price volatility. For example, with 1:5 leverage, You will need only a 20 % margin to open a position. By using 1000 USD You will open a leveraged contract which is worth 5 000 USD.
If you want to read more about CFD and financial leverage You can read information here.
CFD trading on EMISS is speculative and for active traders only the price fluctuations matters on this instrument. This type of contract is a financial agreement which pays out the difference in settlement price between open and closed transaction without any physical delivery of the traded instrument.
This kind of trading gives traders the opportunity to open short and long positions, which means that they can also bet on falling prices, by opening short (SELL) positions. Online trading allows you to trade energy without leaving home, with zero commissions.* Also due to the liquidity of the EMISS and NATGAS market you can close your position with one mouse click at any time when the market is open.
*For monthly turnover equivalent up to 100,000 EUR. Transactions above this limit will be charged a commission of 0.2% (minimum 10 GBP).
But you can’t forget about the risk you are taking during trading instruments with financial leverage. Market volatility can be a disadvantage for some traders. Always remember about managing risk and read about financial leverage before you start trading. You can learn everything from:
- Our XTB educational platform
- EMISS and NATGAS educational articles
The only fees you incur in this case are the spread (the difference between the ASK buy price and the BID sell price) and swap points. The spread is very small and costs cents depending on the size of the position. Swap points are the costs that the broker incurs when financing leveraged positions; swaps are charged daily to the open position.
Trading or investing in energy?
To sum up - investors have a choice of different avenues for trading energy and related instruments. In the XTB platform, investors have full freedom, they can simultaneously invest and trade EMISS or NATGAS contracts.
- Traditional stocks and ETF
- Leveraged, risky CFD instruments suitable for short-term trading like EMISS, NATGAS, stocks or CFD ETFs.
Which one you choose should depend on your level of conviction, character or investment expectations. If you believe in the long-term potential of a 'green transformation' and rising energy prices, it may be wise to invest in an ETF or selected companies in the energy sector. However, if you have a large risk margin and want to look for short-term advantages that the market provides - it may be worth leaning towards CFD instruments. Remember, however, that CFDs carry a higher risk and hundreds of factors influence prices, including seemingly insignificant ones. For example, natural gas prices can be affected by changes in the weather forecast.
Risk under control
Investors are characterised by a propensity to seek returns under all circumstances. Therefore, even in bear markets, there are assets that can behave better than the 'market average'. To sum up we will list 4 fundamental aspects that every investor who wants to reduce and manage risk during trading or investing in energy should focus on:
Knowledge adoption
The desire to gain knowledge is fundamental from the perspective of any investor. To improve your skills, you need to supplement your workshop and subject yourself to various scenarios. But how to do this without trying to find your own strategy and path in investing through education? It is not possible. Learn also the technical side of trading. Before trading CFD instruments - read about them to understand how the market works and what you should be aware of.
Emotions
The stock market is emotions that overlap with fundamentals and often determine the bull market and the bear market. For example, the good performance of a given company may not make the market euphoric if the sector in which it prospers does not enjoy positive sentiment. There are investors who have made thousands of percent by buying shares of weak companies at insanely low valuations, and investors who have lost massive money by investing in great businesses when their valuations were far from fundamentals. The investor's task is to skillfully read the emotions of the market and tame the greed and fear that are the routine of every trader.
Second level thinking
The market is a competitive game in which every trader competes with others sitting 'on the other side of the table'. It is not possible for everyone 'in this game' to make money, although this phenomenon usually occurs during the peak phases of euphoria and speculative bubbles when the portfolio of investors buying expensively priced assets, after huge increases, 'glows green'. Investors who want to beat the market average are hoping for higher returns at the expense of greater risk of loss. In contrast, investors who want to be 'average' and invest in index funds risk beating the market average (which is low in weak periods for the stock market), at the expense of limited gains. Few investors actually beat the 'market average', but when they succeed - they can expect above-average returns.
Thinking 'second level' can allow you to beat the market average significantly which is not and just can’t be easy. Let's say a statistical investor wants to buy shares in a company after a successful quarterly report. However, the out-of-the-box thinking investor will decide to sell those shares because he sees that the company's share price already includes so much good information that 'it can only get worse'. That's what 'second level thinking' is. Isn't that risky? That's right, but if the analysis turns out to be accurate, this investor will probably secure with it a higher rate of return than the statistical investor who did not try to dig into the valuation and did not want to understand the situation 'deeper'
Starting an investment in times of inflation and market panic are seen as 'safer' by seasoned investors like Warren Buffett, Howard Marks and one-time Magellan mutual fund manager Peter Lynch. However, the strategy of all these investors was primarily to invest for the long term. But even with those insights investing during inflation is not easy. Traders should use other metrics and indicators.
Risk/Reward Ratio
From a correct understanding of the profit/reward ratio 'risk/reward ratio, it does not always follow that the greater the risk- the greater the reward will be. If this were the case, the highest returns would give the riskiest assets. So the correct version is the higher the profit, the higher the reward may be, if it will happen. We know that the market always has a reason to identify assets as 'risky' and this status has a reason, reflected in prices. However, an investor may disagree with the reasons why the market evaluates assets as risky and look for advantages in beating the 'market average'. Undoubtedly, understanding the Risk/Reward ratio can help identify opportunities although there are no 'golden methods' of investment.
Learning from mistakes is the best, especially if investors learn from others' mistakes. However, the market is a place where it is hard to go 'dry-footed', and losses are an inseparable part of investing and trading. Gaining knowledge and developing one's own investment methods based on that knowledge can be effective, and it is up to each investor to tailor the above to his or her own individual risk appetite and asset situation.
Trading hours
 Stocks and ETFs trading hours depend on the stock exchange where the company or fund is listed. For US listed companies trading is open from 15:30 CET to 22:00 CET.
What about available EMISS and NATGAS trading hours? This information is especially important for day traders. Emissions trading is available 5 days per week from 8:05 CET to 18:00 CET from Monday to Friday. Spot natural gas trading is available 5 days per week from 8:30 CET to 23:00 CET from Monday to Friday.
Trading on both instruments is not available during weekends on our platform. The Price is static when the market is closed. At all other times the prices are constantly fluctuating.
REIT ETF & Stock - How to Invest in Property
Climate change investments: Maximising impact

ETF vs Shares: What's the Difference?
This content has been created by XTB S.A. This service is provided by XTB S.A., with its registered office in Warsaw, at Prosta 67, 00-838 Warsaw, Poland, entered in the register of entrepreneurs of the National Court Register (Krajowy Rejestr Sądowy) conducted by District Court for the Capital City of Warsaw, XII Commercial Division of the National Court Register under KRS number 0000217580, REGON number 015803782 and Tax Identification Number (NIP) 527-24-43-955, with the fully paid up share capital in the amount of PLN 5.869.181,75. XTB S.A. conducts brokerage activities on the basis of the license granted by Polish Securities and Exchange Commission on 8th November 2005 No. DDM-M-4021-57-1/2005 and is supervised by Polish Supervision Authority.