


This article is for informational and educational purposes only and does not constitute financial advice. Forecasts are third-party estimates, are not a reliable indicator of future results, and can change quickly. Figures are as of late October 2026. Capital at risk.
This article is for informational and educational purposes only and does not constitute financial advice. Forecasts are third-party estimates, are not a reliable indicator of future results, and can change quickly. Figures are as of late October 2026. Capital at risk.
What Is the Oil Price Forecast for 2026 and 2027?
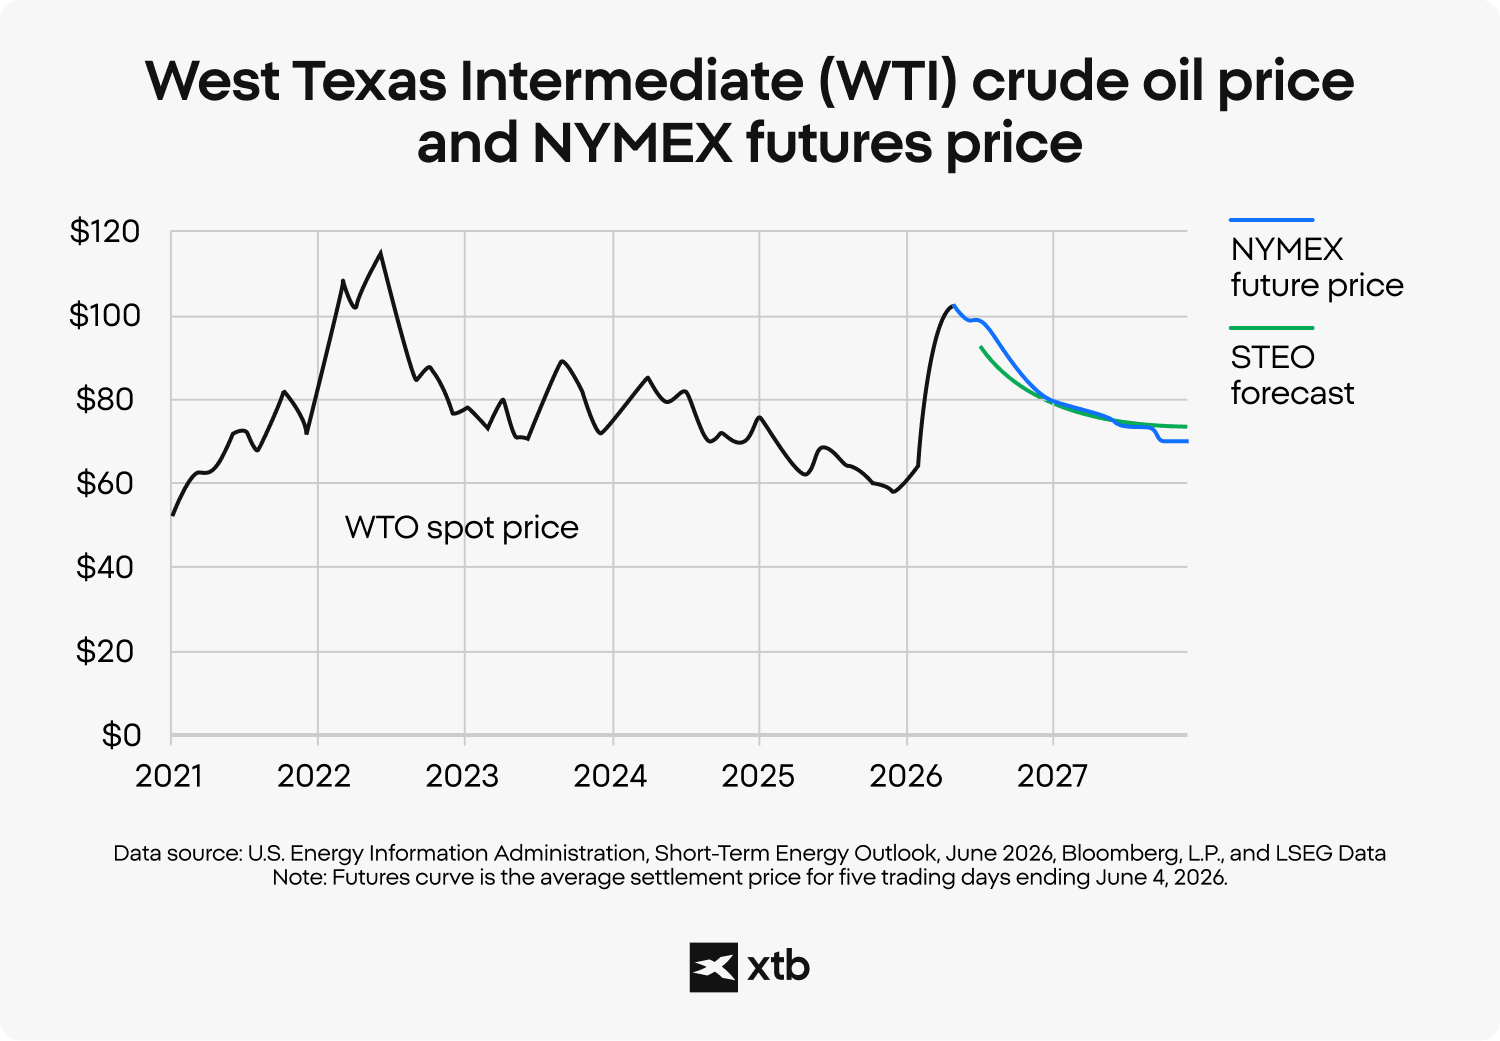
Most major forecasters now expect Brent crude to stay above $90 for the rest of 2026 and then ease through 2027, but the range between them is wide. The US Energy Information Administration (EIA) forecasts Brent averaging about $96 for 2026 and about $84 in 2027. Goldman Sachs is more cautious, at $90 for December 2026 and an $80 average for 2027. The spread between forecasts is the key message. Oil is being priced on geopolitical scenarios, not on a single expected path.
This is a sharp change from mid-2026, when forecasts assumed the Strait of Hormuz was reopening and prices were heading toward $70-80. Fighting resumed around the strait and supply has stayed tight, so most major forecasts have since been revised up.
Key Takeaways
- The EIA has now raised its Brent forecast for three consecutive months, and it expects prices to drift down from their early-October average rather than spike further.
- Forecasts for Q4 2026 cluster around $100-107, with Goldman Sachs at $90 for December and Citi near $70 only if Hormuz reopens.
- Forecasts are scenarios, not certainties. A single supply shock or peace deal can move prices by tens of dollars.
- Oil is a cyclical, geopolitically sensitive commodity, so it carries significant volatility risk.
Where Is Oil Trading Now?
Brent has stayed in an elevated, volatile range through late October. It settled at $116.72 after Houthi strikes on Saudi Arabia, then dipped to around $114 on hopes of peace talks, even though supply threats remained. The EIA says Brent averaged $114 in September, $23 above August. Physical oil is priced differently from futures. The EIA’s Brent spot price, which tracks physical cargoes rather than futures, was $126.55 on 14 October, well above the futures price. This is why you will see different “current prices” depending on the source, and why this article avoids quoting a single live figure.
What Is Driving Oil Prices in 2026?
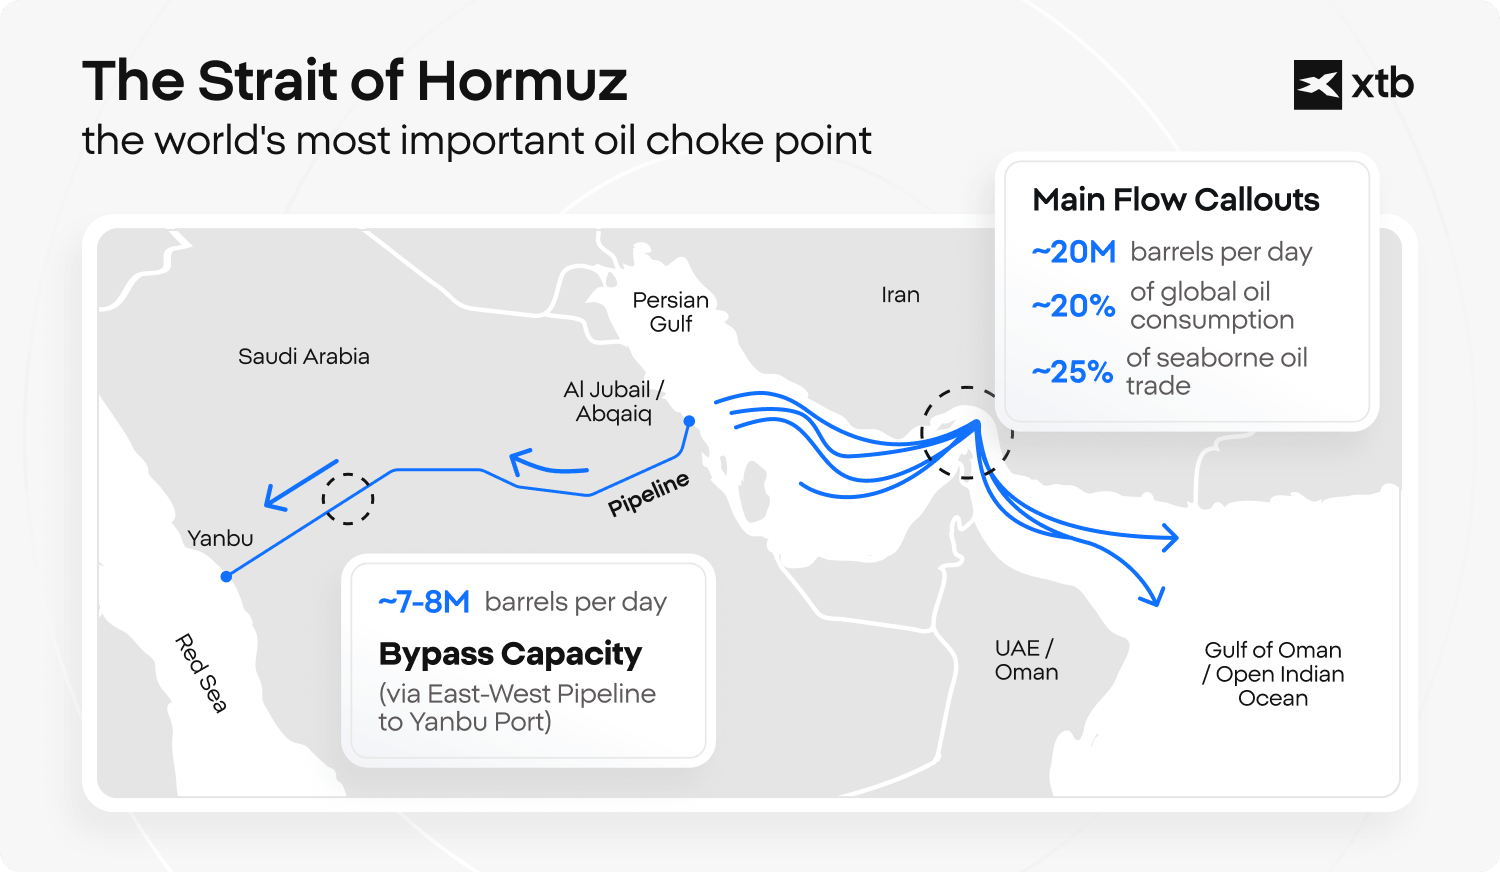
The Strait of Hormuz. The strait normally carries roughly a fifth of the world’s oil consumption. The EIA estimates that flows through it averaged 4.9 million barrels a day in Q2 2026, down from 21.6 million in Q4 2025, with Saudi Arabia rerouting crude through its East-West pipeline to the Red Sea port of Yanbu.
Attacks on supply infrastructure. The EIA highlights attacks on Saudi Arabia’s East-West pipeline as a source of continuing volatility, alongside ongoing global inventory withdrawals. The pipeline matters because it is the main bypass around Hormuz.
Diesel tightness. The EIA also points to extreme tightness in diesel markets, which raises refiners’ demand for crude.
Demand and the economy. Slower global growth, higher interest rates and weaker consumer spending are the main counterweights to tight supply. Read our Federal Reserve forecast and UK interest rate forecast to see how rates feed back into energy demand.
OPEC+ and non-OPEC supply. Production decisions by OPEC+ and rising US output still shape the medium-term balance. Our guide to the world’s largest oil producers explains who supplies the market.
The US dollar. Oil is priced in dollars, so a stronger dollar makes crude more expensive for importers and can weigh on demand.
Oil Price Forecasts: What the Major Institutions Expect
|
|
|
|
|
|
|
|
|
|
|
|
|
|
|
|
|
|
|
|
|
|
|
|
|
|
|
|
Sources: EIA short-term outlook (October 2026), Morgan Stanley and Goldman Sachs notes reported in October 2026, and a roundup of bank forecasts. Forecasts change frequently. Not a guide to future results.
Why such a spread? Banks make different assumptions about how quickly Gulf exports recover. Goldman’s upside scenario, for example, has Brent averaging about $125 in 2027 if Gulf output stays around 5 million barrels a day below February levels. The lowest forecasts assume the strait reopens quickly. The highest assumed constrained flows into 2027.
What Could Push Oil Prices Higher?
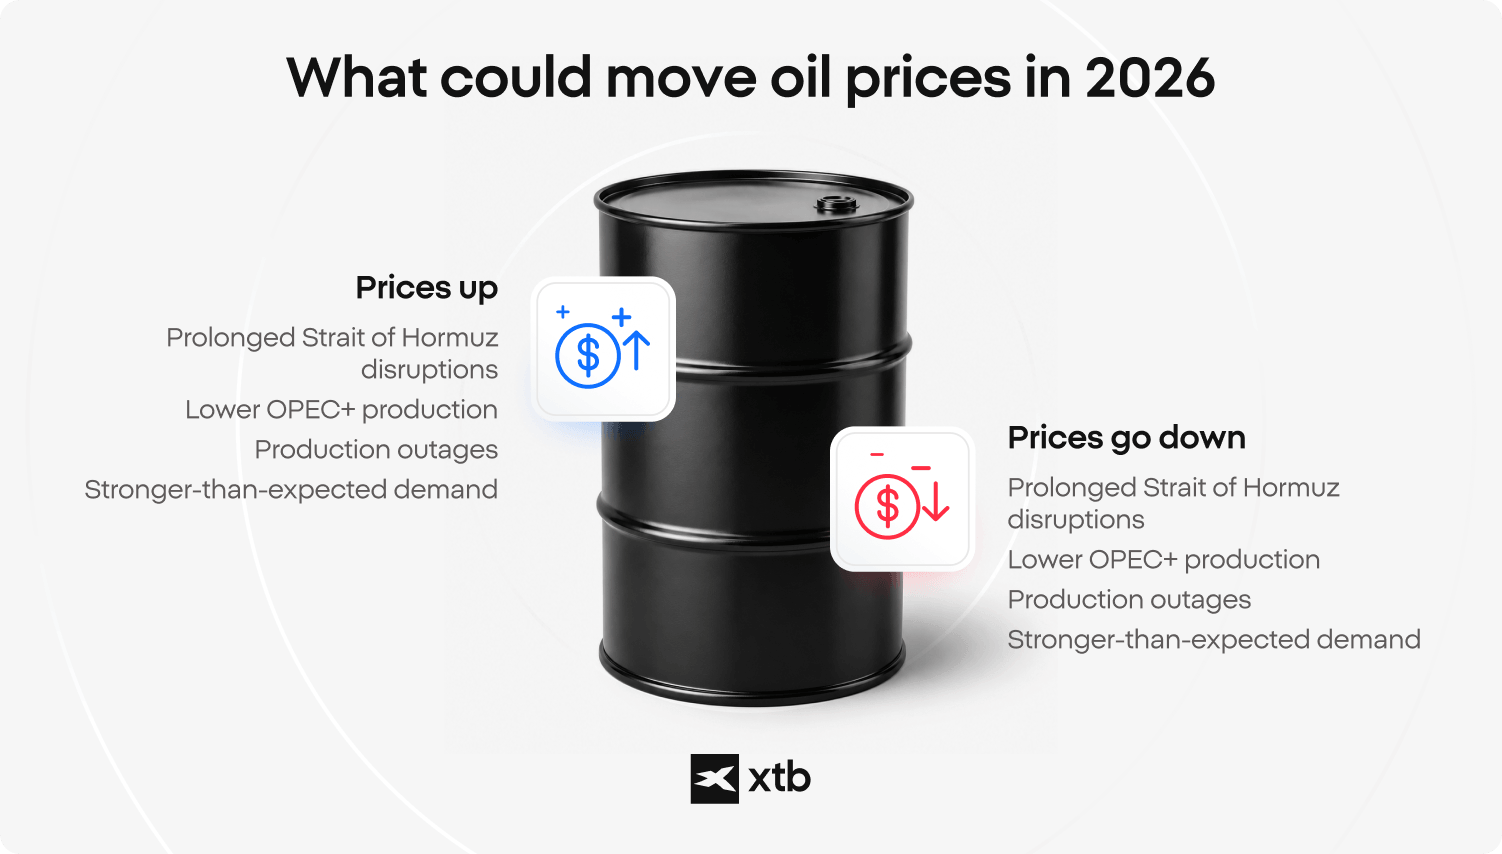
- Further attacks on Saudi export routes or Gulf shipping
- Continued inventory draws as supply stays constrained
- Persistent diesel and refined-product shortages
- Collapse of peace talks between the US, Iran and Gulf states
- Stronger-than-expected demand, or slower non-OPEC supply growth
What Could Push Oil Prices Lower?
- A credible, durable reopening of the Strait of Hormuz
- A lasting US-Iran or Gulf agreement, and easing of sanctions
- Weaker global growth cutting fuel demand
- Rising OPEC+ and US production
- Peace between Russia and Ukraine, easing pressure on Russian supply
History shows that oil reacts to fear of disruption as well as to actual shortages. In 1973 an Arab embargo roughly quadrupled prices within months, and during the 1984-88 Tanker War, risk premiums rose even though output did not collapse. This is why headlines can move prices quickly, in both directions.
How Do Oil Prices Affect Investors Who Don’t Hold Oil?
Even if you never trade crude, oil prices affect your portfolio:
- Inflation and interest rates. Higher oil raises fuel and transport costs, which can keep inflation elevated and delay rate cuts, which in turn affects bond and equity valuations.
- Energy stocks. Producers such as BP and Shell, which have a large weighting in the UK 100, tend to benefit from higher crude. Airlines, logistics and manufacturers face higher costs.
- Currencies. Oil-linked economies and oil importers can see their currencies move with crude. Explore forex trading.
- Gold. Oil shocks can support gold as a defensive asset. Read our guide to gold trading.
- Elections and policy. Energy policy is a major theme in the US midterms. See our guide to why markets care about the midterms.
Oil behaves differently from gold. It is a cyclical industrial commodity, not a defensive store of value.
Is Oil a Good Investment Right Now?
There is no single answer, and this article does not make recommendations. What matters is whether oil fits your time horizon, risk tolerance and portfolio.
Points investors often weigh:
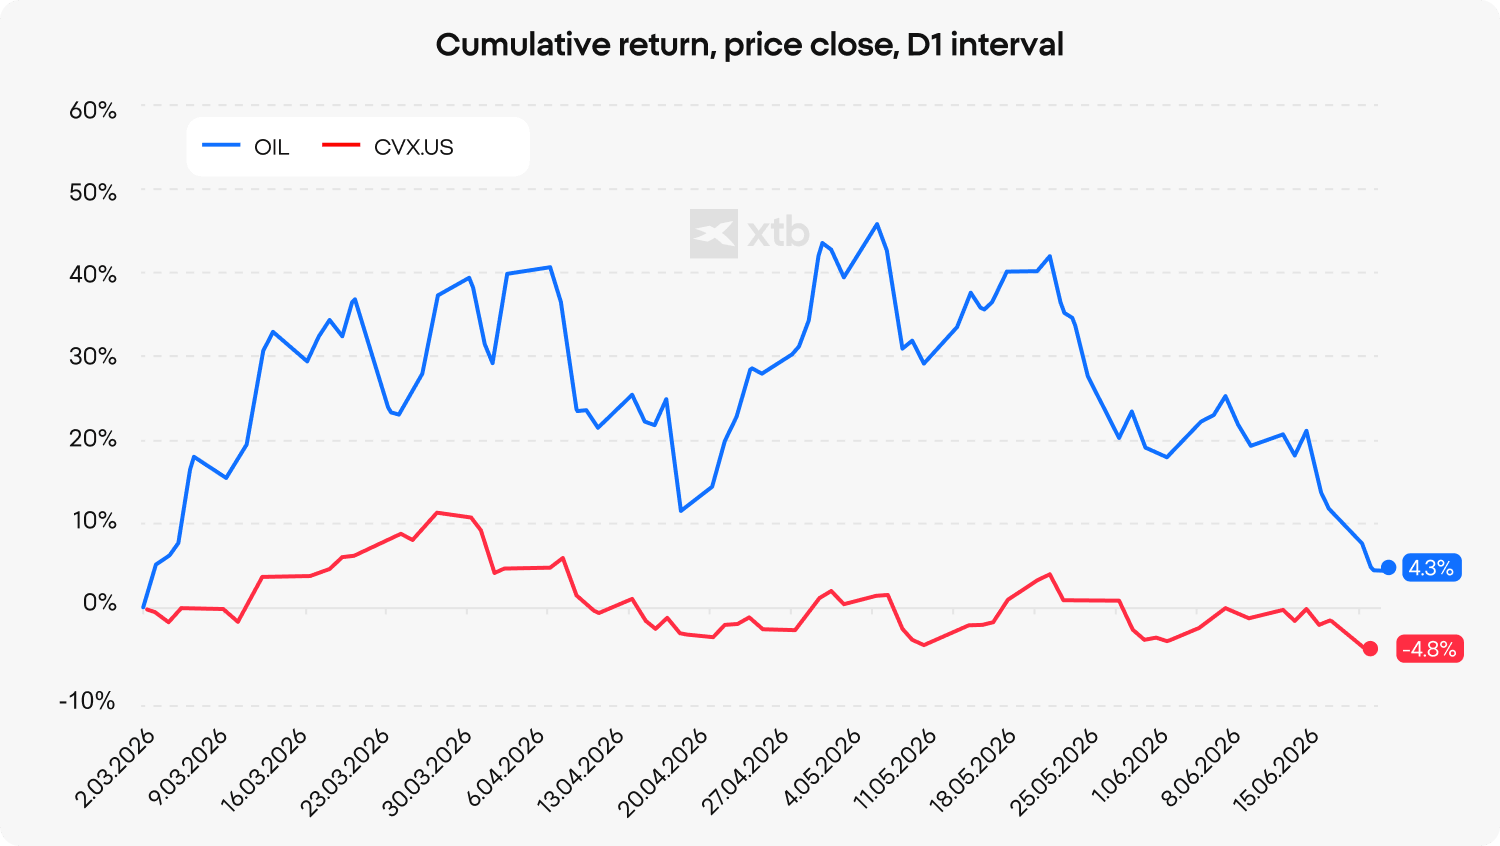
- Volatility is extreme. Prices have swung by tens of dollars within weeks in 2026.
- Forecasts disagree. When the EIA, banks and analysts differ by $30 or more, that’s a signal of uncertainty, not opportunity.
- Concentration risk. Oil adds geopolitical exposure that may not improve diversification.
- Timing risk. Headlines can reverse a move within hours.
If you want exposure, there are several routes, each with different risks:
- Energy shares. Buy producers through XTB’s shares platform. Share prices don’t track crude one-for-one.
- ETFs. Energy-sector and commodity ETFs offer diversified exposure. Commodity ETFs often use futures, which can behave differently from the spot price.
- CFDs. CFDs let you speculate on oil price moves with leverage, going long or short. They carry a high risk of rapid losses.
For a full breakdown, read our guides to how to invest in oil, the oil investing guide covering stocks, ETFs and CFDs and oil trading. To understand the two main benchmarks, read our explainer on Brent vs WTI. New to commodities? Start with our commodity trading guide.
Risk Warning
CFDs are complex instruments and come with a high risk of losing money rapidly due to leverage. 74% of retail investor accounts lose money when trading CFDs with this provider. You should consider whether you understand how CFDs work and whether you can afford to take the high risk of losing your money.
Capital at risk. Investment values can rise or fall.
Forecasts referenced in this article are third-party estimates as at late October 2026 and are subject to change. They are not a reliable indicator of future performance and do not constitute financial advice.
FAQ
The EIA expects Brent to average about $96 in 2026, with Q4 averaging about $105. Goldman Sachs expects $90 by December, and Morgan Stanley expects $105 in Q4. Forecasts depend heavily on whether Gulf exports recover.
The EIA forecasts Brent averaging around $84 in 2027, and Goldman Sachs forecasts $80. Both assume prices ease as supply recovers. Goldman’s upside scenario, however, reaches about $125 if Gulf output stays depressed.
Supply has stayed tighter than banks expected. Fighting resumed around the Strait of Hormuz, shipments through it remain far below normal, and attacks on Saudi infrastructure have added to volatility.
Analysts make different assumptions about the pace of Gulf supply recovery, demand, OPEC+ policy and inventories. Small changes in those assumptions produce very different price targets.
Futures prices, which most charts show, differ from spot prices, which reflect physical cargoes. In tight markets, spot prices can run well above futures.
Brent is the international benchmark, and WTI is the US benchmark. Brent usually trades at a premium. The EIA’s Q4 forecast has Brent at about $105 and WTI at about $97.
Yes. Prices react to the risk of disruption as well as to actual shortages, so a single attack or ceasefire headline can move crude sharply.
No. Oil is a cyclical, volatile commodity tied to growth, supply policy and geopolitics, and is generally considered higher risk than diversified assets such as broad-market ETFs.

The Outlook for Commodities in the Second Half of 2024

The Israel-Iran conflict explained and its effect on the global markets

How to Invest in Gold: 4 Methods Explained and Compared
This content has been created by XTB S.A. This service is provided by XTB S.A., with its registered office in Warsaw, at Prosta 67, 00-838 Warsaw, Poland, entered in the register of entrepreneurs of the National Court Register (Krajowy Rejestr Sądowy) conducted by District Court for the Capital City of Warsaw, XII Commercial Division of the National Court Register under KRS number 0000217580, REGON number 015803782 and Tax Identification Number (NIP) 527-24-43-955, with the fully paid up share capital in the amount of PLN 5.869.181,75. XTB S.A. conducts brokerage activities on the basis of the license granted by Polish Securities and Exchange Commission on 8th November 2005 No. DDM-M-4021-57-1/2005 and is supervised by Polish Supervision Authority.