
The kay US labor market data NFP prompted investors to return to the dollar today, driving Treasury yields higher and putting technical pressure on assets that are traditionally viewed as negatively correlated with the strength of the US currency, including Bitcoin and gold. Bitcoin has fallen below $62,000 and is now down roughly 55% from its recent highs, while gold is losing around 1.5% and has slipped below its 200-day exponential moving average on the daily chart - a key support level for long-term momentum.
Technical Analysis: Gold (D1)
A daily close below the EMA200 (red line) could signal the risk of a deeper decline toward the $4,100 area, corresponding to the local lows seen in February. Such a move would imply a correction of roughly 30% from gold’s all-time high.
A downside breakout from the current triangle formation could trigger another bearish impulse, with the first major support located near the previous panic low. On the other hand, a recovery toward the $4,500–4,600 range would increase the likelihood of continued consolidation and potentially set the stage for an upside breakout, with the first major resistance zone located around $4,750–4,800.
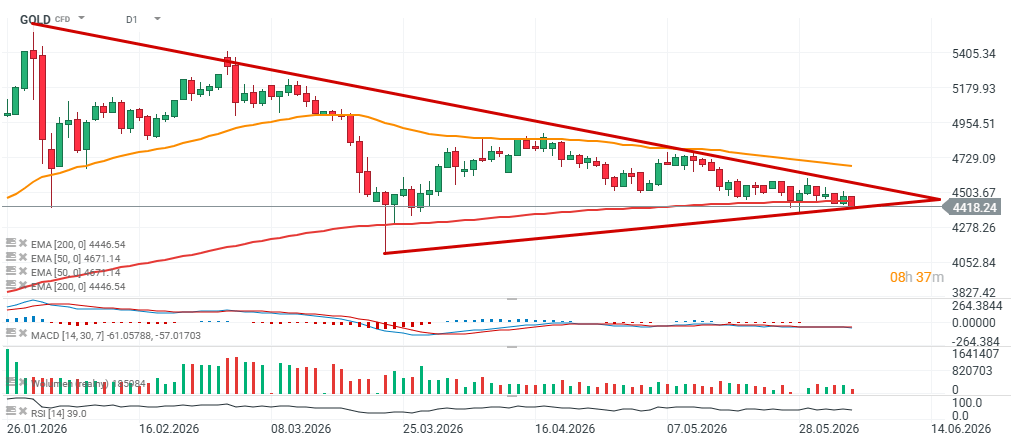
Source: xStation5
Technical Analysis: Bitcoin (D1)
Looking at the world's largest cryptocurrency, market panic has clearly intensified. Bitcoin is currently trading near $62,000, its lowest level since February 5, 2026.
The RSI indicator stands at 17.4, signaling extremely oversold conditions after the price was once again rejected following a recent move toward overbought territory near the 70 level.
Comparing the current cycle with the 2021–2022 bear market reveals notable similarities, particularly what could be described as a "third phase" of panic selling. During the third major downward leg in 2022, Bitcoin fell to around $22,000 before ultimately finding a final bottom near $15,000 in November.
If the current decline were to follow a similar pattern and extend by another 30% from current levels, it would imply a potential downside target near $43,000. At the same time, the $60,000 level remains a crucial support zone for bulls. A break below that threshold could trigger a new wave of long-position liquidations and further accelerate downside momentum.
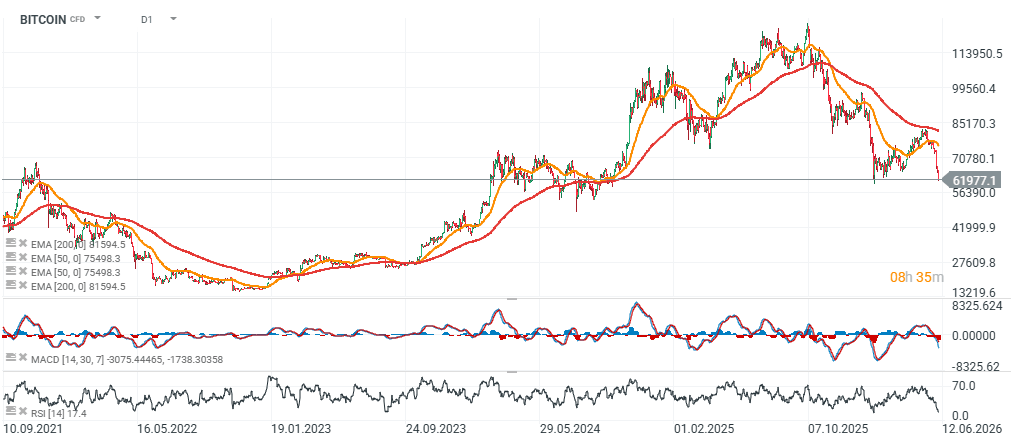
Source: xStation5
US Open: Blood on Wall Street as Semiconductor Sector Extends Correction

Wheat futures hit two-year high 🔼 Russian exports at risk

Cocoa rises on a wave of rebounding demand in Asia. Europe remains in retreat

A win for England: first half growth on positive track, keeps pound buoyant
This content has been created by XTB S.A. This service is provided by XTB S.A., with its registered office in Warsaw, at Prosta 67, 00-838 Warsaw, Poland, entered in the register of entrepreneurs of the National Court Register (Krajowy Rejestr Sądowy) conducted by District Court for the Capital City of Warsaw, XII Commercial Division of the National Court Register under KRS number 0000217580, REGON number 015803782 and Tax Identification Number (NIP) 527-24-43-955, with the fully paid up share capital in the amount of PLN 5.869.181,75. XTB S.A. conducts brokerage activities on the basis of the license granted by Polish Securities and Exchange Commission on 8th November 2005 No. DDM-M-4021-57-1/2005 and is supervised by Polish Supervision Authority.