The break of the psychological barrier of $4,000 per ounce is a sharp reality check after the historical records that gold was setting at the beginning of the year. The precious metals market has painfully reminded itself of the force of gravity, despite the fundamental change in market conditions that should be working in gold's favour. What is the current situation?
Gold below $4,000
As recently as the end of January 2026, gold was testing astronomical levels around $5,600 per ounce. Today's drop to the $4,000 range represents a massive, nearly 30 per cent decline from the peak.
The main driver of this price decline is a sudden shift in the perception of US monetary policy and the resulting strong strengthening of the dollar (the dollar index is hitting 13-month highs). Gold is priced in dollars, so a strong "greenback" automatically makes the precious metal more expensive for foreign investors. Given the very weak jewellery demand in the previous quarter, an expensive dollar may result in a lack of prospects for a quick rebound in base demand, even with strong central bank purchases. Inflation is a mixed factor for gold. In the long term, inflation is positive for gold. In the short term, not necessarily. Now we have a drop in inflation expectations, to which gold also reacts with a decline. 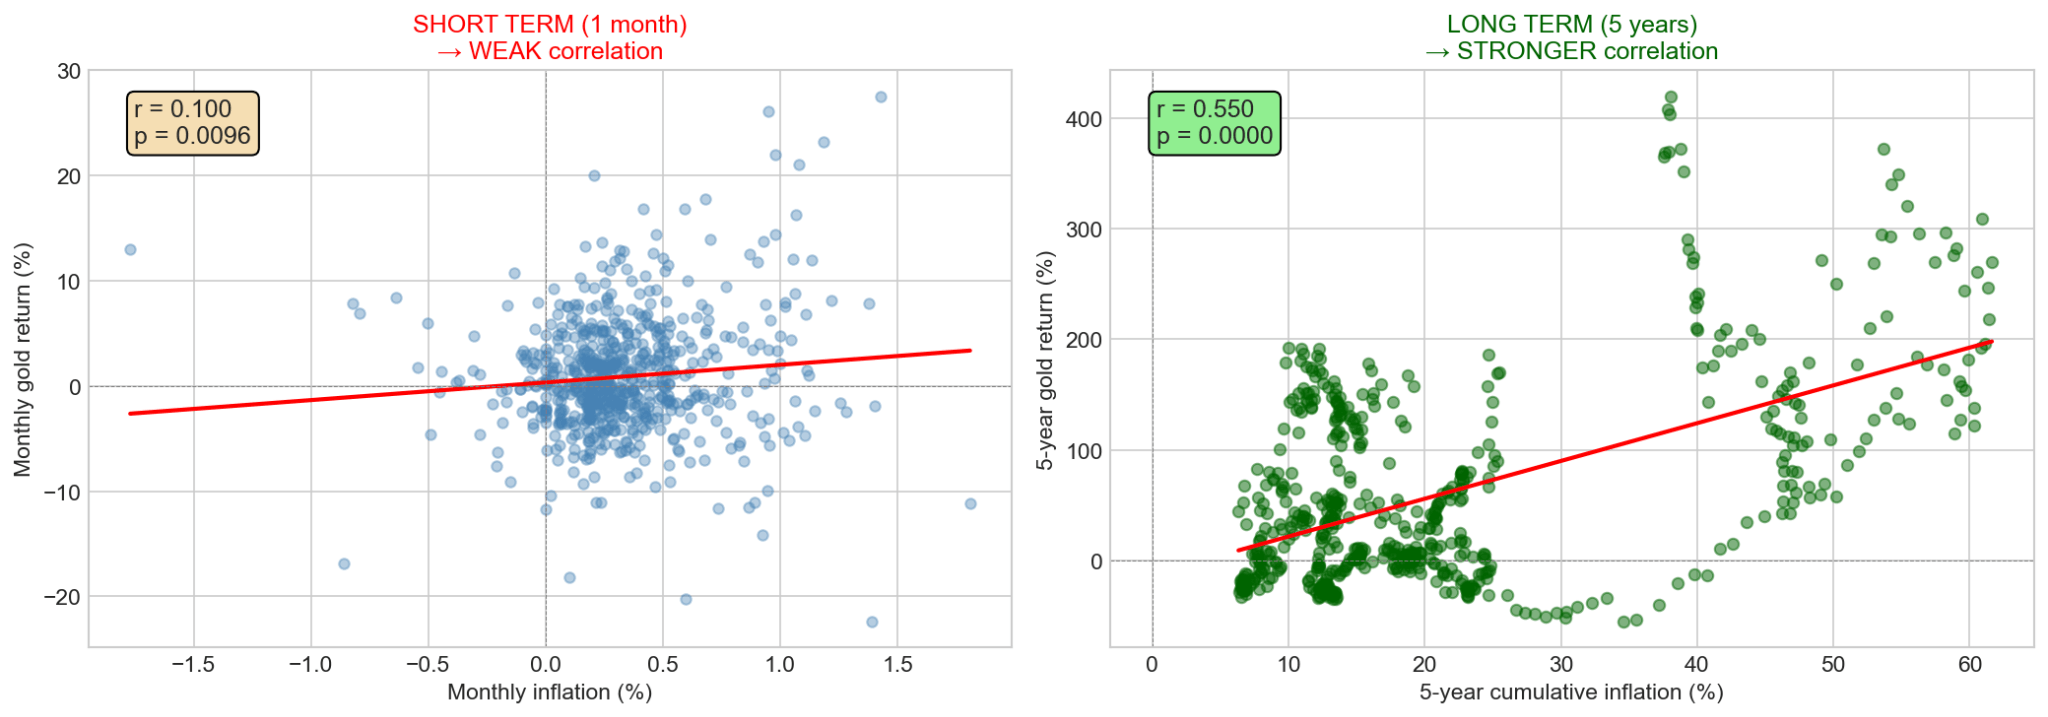 In the long term, the correlation between gold and inflation is more obvious than in the short term. Source: Bloomberg Finance LP, XTB
Historical gold price drops. Is 30% a lot?
For investors accustomed to the stable growth of 2025, the current 30% drop looks dramatic. However, looking historically, gold is an extremely volatile asset that can enter a bear market for decades.
- The Great Drawdown (1983–2007): The deepest and most exhausting decline in modern gold history. It amounted to as much as -54%. What's worse, it took investors almost 25 years to recover losses and return to historical highs.
- Post-boom Crisis (2011–2015): After reaching its then-peak (approx. $1,920), gold slid by about -45%, falling to around $1,050.
- Market Structure: Statistics show that over the last 50 years, gold has spent almost half of that time in drawdowns exceeding 20–30%. The current correction is therefore within the "standard" repertoire of this precious metal. A decline of 30% gives hope that the declines will soon slow down.
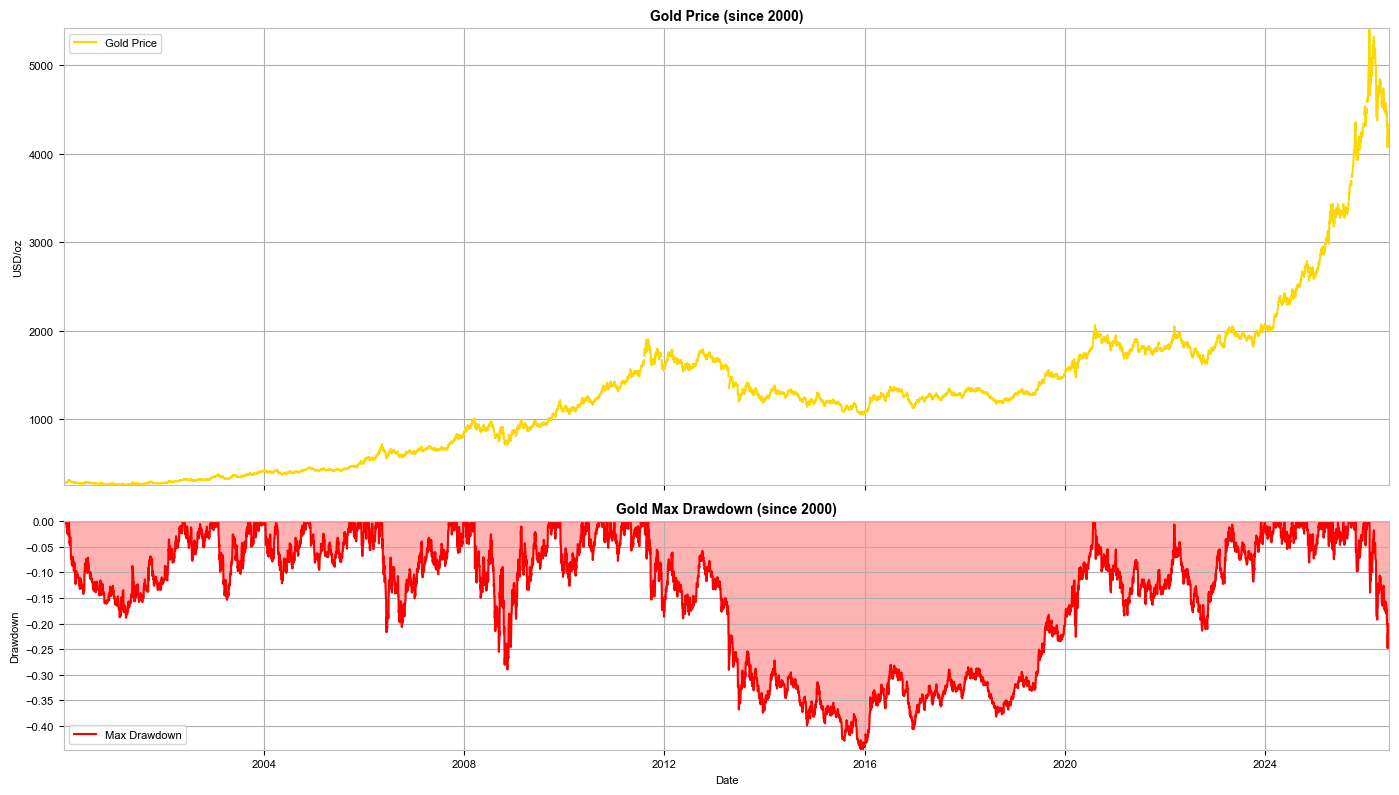 Gold price drops since 2000. Source: Bloomberg Finance LP, XTB
What drives gold declines?
- Opportunity Cost: Gold does not pay interest, dividends, or coupons. When Treasury bonds offer high, real rates of return, capital flees gold to assets that generate real income.
- Outflow from ETP/ETF funds: Institutional investors, in the face of higher rates, are reducing their positions in paper gold, which fuels a sell-off spiral in the spot market.
- Calming of geopolitical panic: Although tensions around Iran and in the Middle East continue, the market has partially "learned" to live with them, which reduces demand for safe havens.
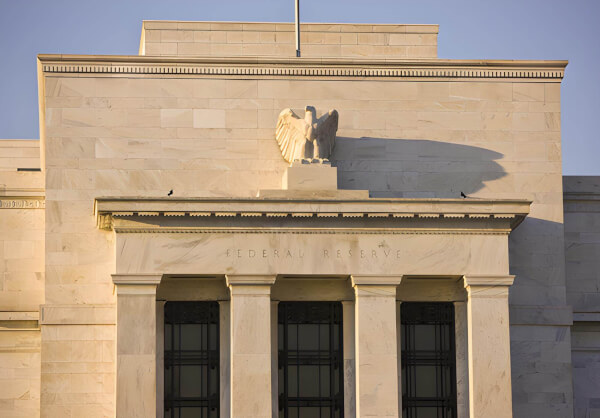
Is Warsh really that hawkish?
The new Fed chief, Kevin Warsh (who took the helm in May 2026), immediately shook the markets, and the market read this as a clear hawkish pivot. Is it really?
At the June conference, Warsh did something the markets did not expect: he completely abandoned "forward guidance" (i.e., giving the market clear indications of what the Fed would do in a few months). He announced that only hard, current data matters, and his goal is to absolutely bring inflation down to a level where "the number two is to the left of the decimal point."
However, it is worth noting that Warsh also complained about current inflation measures and forecasts. He appointed several working groups aimed at developing new standards, and their work will be presented at the end of the year. Therefore, it is highly likely that we will not see any moves from the Fed until then. Warsh also wants to emulate the recently deceased Alan Greenspan, who preferred a rather calm approach to interest rate changes.
Can rates rise despite falling oil prices?
Indeed, oil prices have experienced a spectacular slide from wartime maximums (reaching $120 during the escalation in the Strait of Hormuz) and returned to the levels of the first session of the conflict, around $70 per barrel. It might seem that this removes the pressure on the Fed. However, Warsh sees it differently:
- Sticky core inflation: Despite cheaper fuel, US core inflation and PCE indicators (projected at 3.6% this year) remain far above the target.
- Warsh's monetary doctrine: The new Fed chief believes that inflation is primarily caused by money supply and monetary policy, not temporary commodity shocks.
- Lack of forecasts from Warsh: The new chief did not present his dot-plot forecast for interest rates. On the one hand, it seems he did not want to communicate changes, but on the other hand, he may not have wanted to expose himself to Trump's potential anger if he is, in fact, aiming for rate hikes.
The market is treating the risk of an interest rate hike very seriously, even as early as September 2026. This is the worst possible scenario for gold: a strong dollar, high rates, and a Fed chief who has no intention of taking his foot off the brake. On the other hand, such a strong increase in expectations now potentially gives a chance for a significant rebound in the price of the precious metal if market expectations change by 180 degrees.
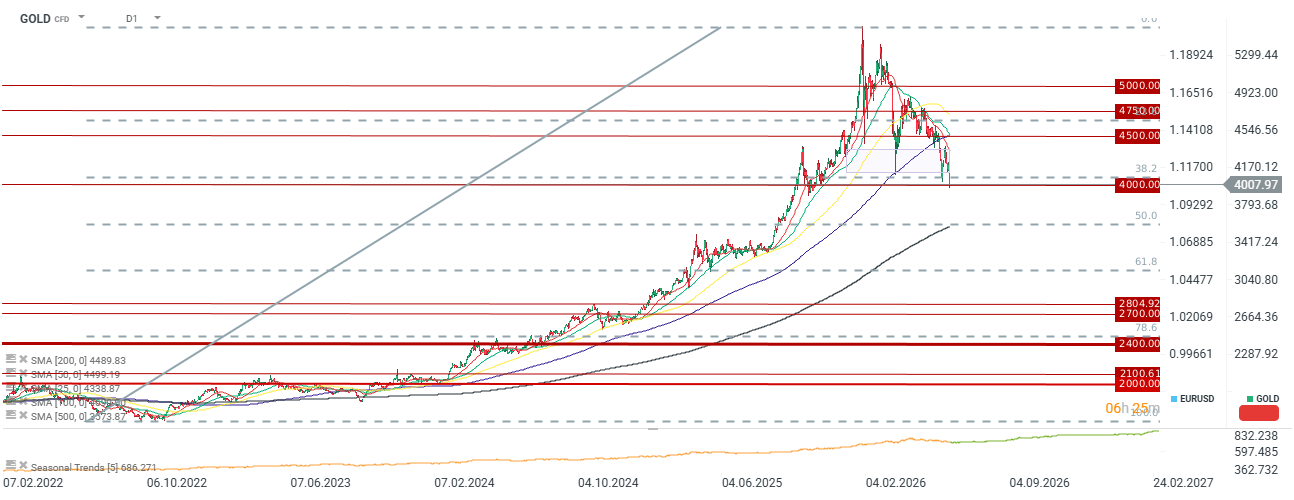
Gold is falling below $4,000 per ounce and the 38.2 retracement. The next important support is the 2-year average and the 50.0 retracement, which is at the level of 3570. Source: xStation5
Daily Summary: Lower inflation weakens the dollar and awakens gold and S&P 500 to gains

Earnings bonanza for US banks
Fed Chair Kevin Warsh’s Q&A from Congress Testimony: Inflation stability is a key

Bypassing Hormuz: Gulf States Race Against Time
This content has been created by XTB S.A. This service is provided by XTB S.A., with its registered office in Warsaw, at Prosta 67, 00-838 Warsaw, Poland, entered in the register of entrepreneurs of the National Court Register (Krajowy Rejestr Sądowy) conducted by District Court for the Capital City of Warsaw, XII Commercial Division of the National Court Register under KRS number 0000217580, REGON number 015803782 and Tax Identification Number (NIP) 527-24-43-955, with the fully paid up share capital in the amount of PLN 5.869.181,75. XTB S.A. conducts brokerage activities on the basis of the license granted by Polish Securities and Exchange Commission on 8th November 2005 No. DDM-M-4021-57-1/2005 and is supervised by Polish Supervision Authority.