
Cryptocurrencies have been gaining momentum in recent days. Let’s have a look at Bitcoin’s technical situation. Taking a look at the daily interval, one might notice that the price successfully broke above the key resistance area near $41,000. The zone was marked with 1:1 structure (red boxes) and previous price actions. Smashing through the mentioned resistance and the downward trend line may actually lead to the sentiment reversal. Should the upward move continue, the area near $47,000 could be the next key resistance (50% Fibonacci retracement of the sell-off started in April and previous local lows).
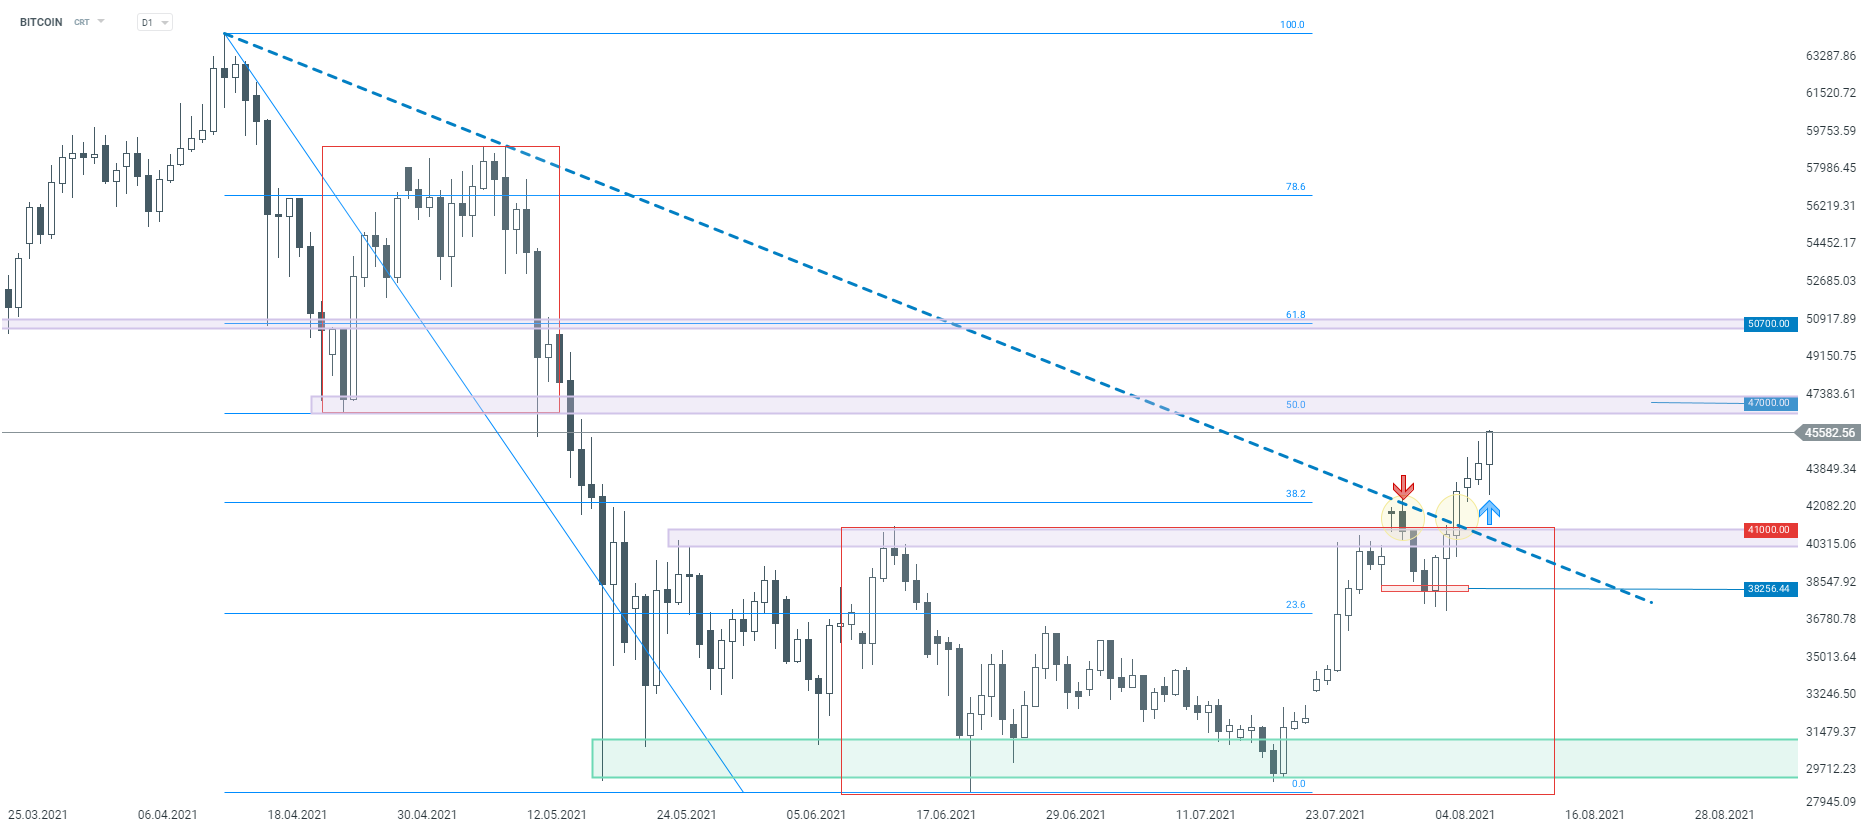 Bitcoin, daily interval. Source: xStation5

Daily Summary: Trump's War Threats Weigh on Markets. Wall Street Sinks into the Red

Bitcoin Climbs Above $66,000 as ETF Flows Recover but Glassnode Warns of Higher Volatility

Morning Wrap: Oil Climbs Back Above $90 as Chinese AI Weighs on Tech Stocks.

Morninga Wrap: Wall Street Under Pressure. AI Loses Momentum, Netflix Disappoints, and the Persian Gulf Erupts