
Bitcoin is sliding to $69,000 today and the chart shows some clear similarities between the late-October selloff, when price fell from roughly $112,000 to around $80,000, and the most recent leg down from about $97,000 to $60,000.
- If we assume a 1:1 replay of that earlier move, not only as a pullback but also in terms of the rebound and the consolidation that followed, the $72,000–$73,000 area could emerge as a meaningful resistance zone. That would mirror the prior rebound of roughly 20%, when Bitcoin climbed from around $80,000 in November to about $97,000 in early 2026.
- If a similar amount of time were to pass before the next major impulse (potentially another downside leg), the next volatility spike might not show up until April. And if the next move were to match the previous downswing in magnitude on a 1:1 basis, Bitcoin could potentially drop toward $49,000, measured from the $72,000 area.
- Meanwhile, the RSI has rebounded from extremely oversold levels near 18 and now sits just below 32. To truly flip the bearish momentum, Bitcoin would likely need to reclaim levels above $80,000. However, the heavy supply suggested around $72,000–$73,000 indicates the market remains cautious and still visibly “shaken.”
Bitcoin (D1 timeframe)
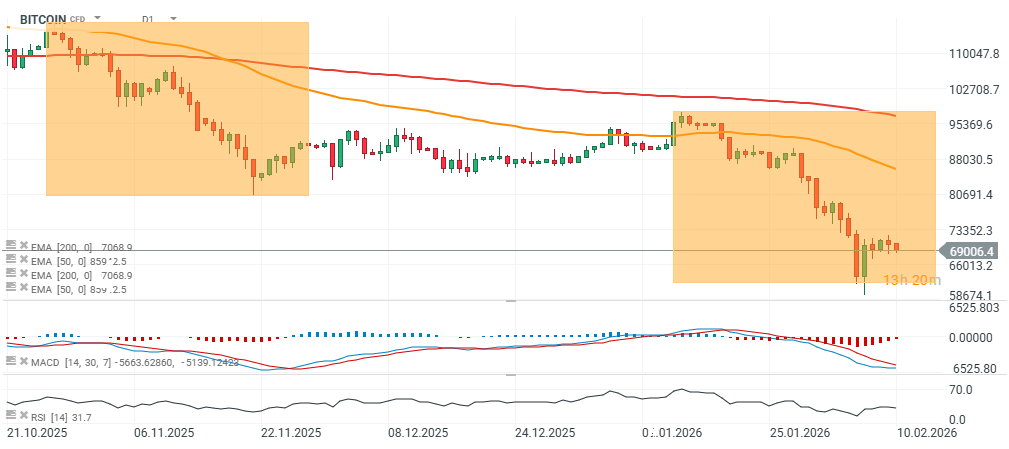
Source: xStation5

Daily Summary: The week ends on a positive note. SK Hynix up 14% on Nasdaq. Energy down (10.07.2026)

Three markets to watch next week (10.07.2026)

Fed presents its semi-annual report. Stocks are expensive but no bubble?

BREAKING: Iran and US are back at the negotiation table?! Oil takes a step back, stocks tick up!