
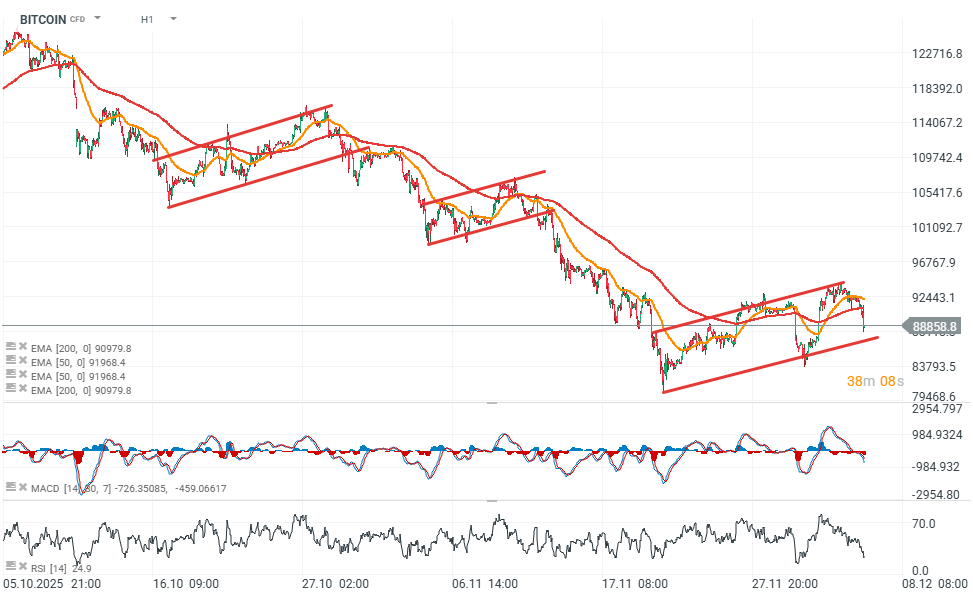
Bitcoin is posting a 3% decline, partly driven by a brief weakening of sentiment in the U.S. stock market, where major indices have given back part of their previous gains. On the other hand, we have not seen any news that could directly hurt cryptocurrencies, which suggests that the pullback is more technical and cyclical in nature. Looking at Bitcoin’s chart, we can see a potential bearish flag pattern that has already appeared twice before during the drop from around 126,000 USD.
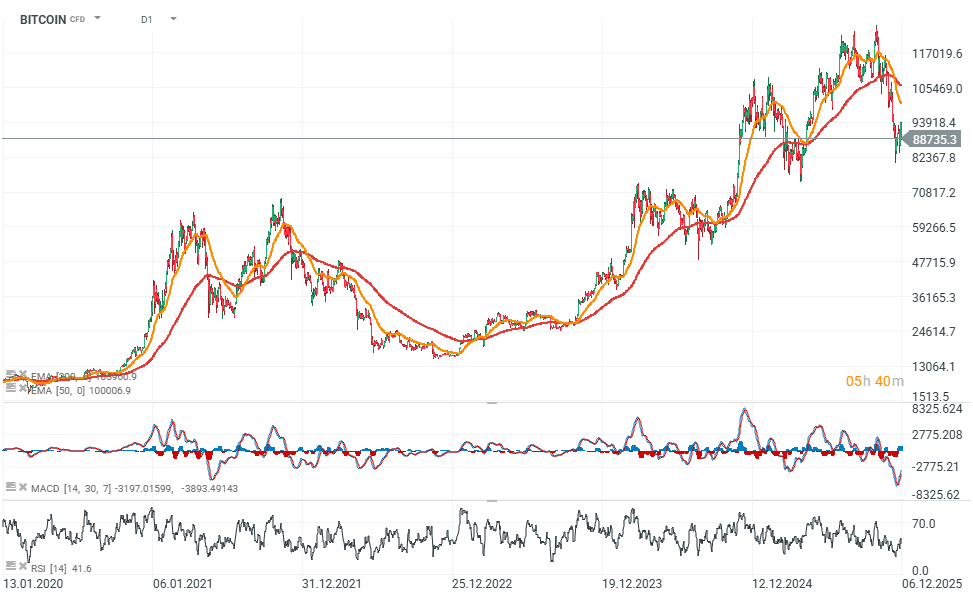
If the price breaks downward from the pattern and confirms it, the potential decline could reach as much as 20 percent, targeting the 69,000–70,000 USD region, which corresponds to the local pre-halving peak from 2024. On the flip side, a move back above 95,000 USD could invalidate the pattern and increase the probability of a rally toward 100,000 USD.
Bitcoin (H1, D1 timeframe)
Source: xStation5
Source: xStation5


Daily Summary: Chip War Weighs on Wall Street as Oil Plunges After US–Iran Ceasefire ⭐

Nasdaq-100 under pressure after chip sell-off

China Is Building Its Own Chip-Making Machines. ASML Under Pressure as the Technology War Enters a New Phase

US Open: Wall Street Rebounds After US Iran Ceasefire