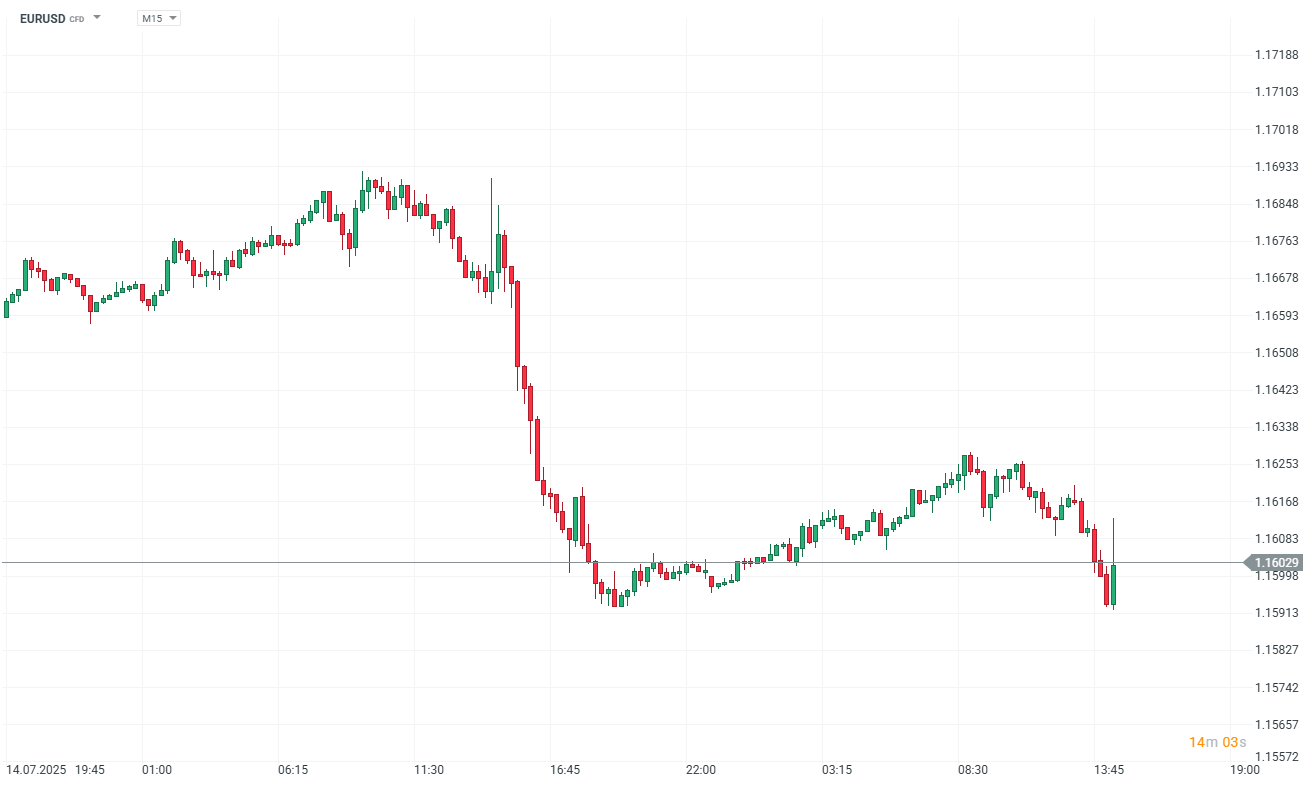
01:30 PM BST, United States - Inflation Data for June:
- PPI: actual 2.3% YoY; forecast 2.5% YoY; previous 2.7% YoY;
- PPI: actual 0.0% MoM; forecast 0.2% MoM; previous 0.3% MoM;
- Core PPI: actual 2.6% YoY; forecast 2.7% YoY; previous 3.2% YoY;
- Core PPI: actual 0.0% MoM; forecast 0.2% MoM; previous 0.4% MoM;
- PPI ex. Food/Energy/Transport: actual 2.5% YoY; previous 2.8% YoY;
- PPI ex. Food/Energy/Transport: actual 0.0% MoM; previous 0.1% MoM;
In June 2025, U.S. producer prices were flat overall, as a 0.3% rise in goods prices offset a 0.1% drop in services. Core PPI (excluding food, energy, and trade) was unchanged on the month and up 2.6% year-over-year. Goods inflation was driven by higher prices for energy and various consumer products, despite a sharp drop in egg prices. Services were weighed down by declines in travel and accommodation costs. Intermediate demand saw mixed results, with slight increases in prices for processed and unprocessed goods but declines in service costs at several production stages. Year-over-year, final demand PPI rose 2.3%.


BREAKING: US100 jumps amid stronger than expected US NFP report

📈 Gold jumps 1.5% ahead of NFP, hitting its highest level since Jan. 30

Economic calendar: NFP data and US oil inventory report 💡

Silver rallies 3% 📈 A return of bullish momentum in precious metals?


