
Looking at AUDUSD on the H4 interval, one can see that the pair has been trading in a consolidation range recently. However, according to the classic of technical analysis, head and shoulders pattern has formed. Should the break below the neckline of formation occur (area near 0.77), the downward move may accelerate. On the other hand, defending the support at 0.77 could lead to a resumption of an upward move. In such a scenario, the nearest potential target for buyers will be the 0.7820 resistance which is marked with previous price reactions. One should be aware that the market may become more volatile once key US data (ADP report) is released at 1:15 pm BST.
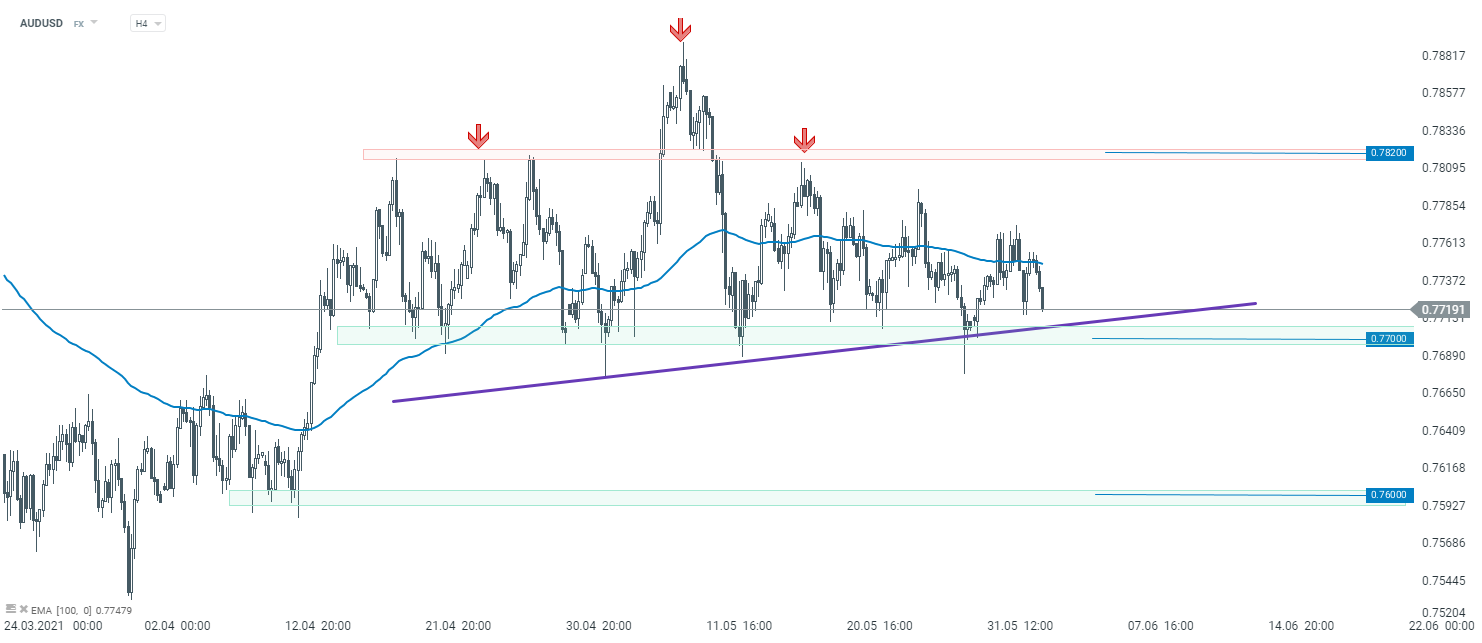 AUDUSD H4 interval. Source: xStation5

Daily Summary: Wall Street Regains Ground; Another Intervention in the Yen Market❓

Three Markets to Watch Next Week (July 31, 2026)

Market Wrap: European equities at 3-week highs! Apple dips in US premarket!

Chart of the Day: EURUSD after the Fed meeting. The market scales back rate hike expectations