
Cryptocurrencies are extending declines at the start of the week. Bitcoin lost nearly 0.7% at the start of Monday's session, Ethereum nearly 1.5%, and Solana nearly 2.2%. On Friday, we observed another consecutive daily net outflow of nearly $190 million from spot ETFs.
The extension of the downward momentum increases the chance that the most popular cryptocurrency could test another important technical support point, which is marked by both the 100-day exponential moving average (purple curve in the chart below; running in the $64,000 zone) and the realized price of short-term BTC holders, which represents the average purchase price of Bitcoin by portfolios with an average holding period for these digital assets of less than 155 days.
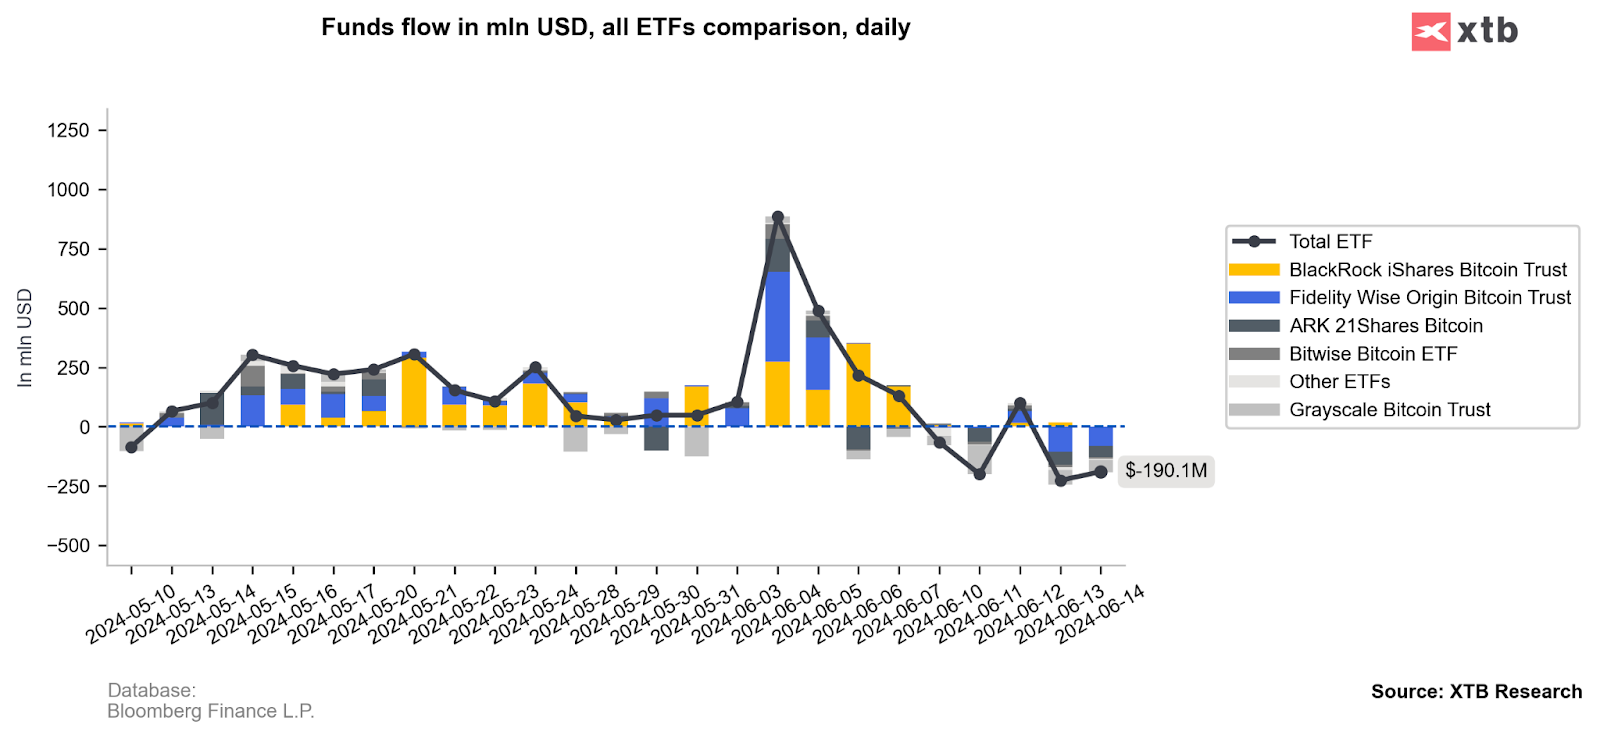
The ETF data indicates further net outflows from BTC spot funds. Source: XTB
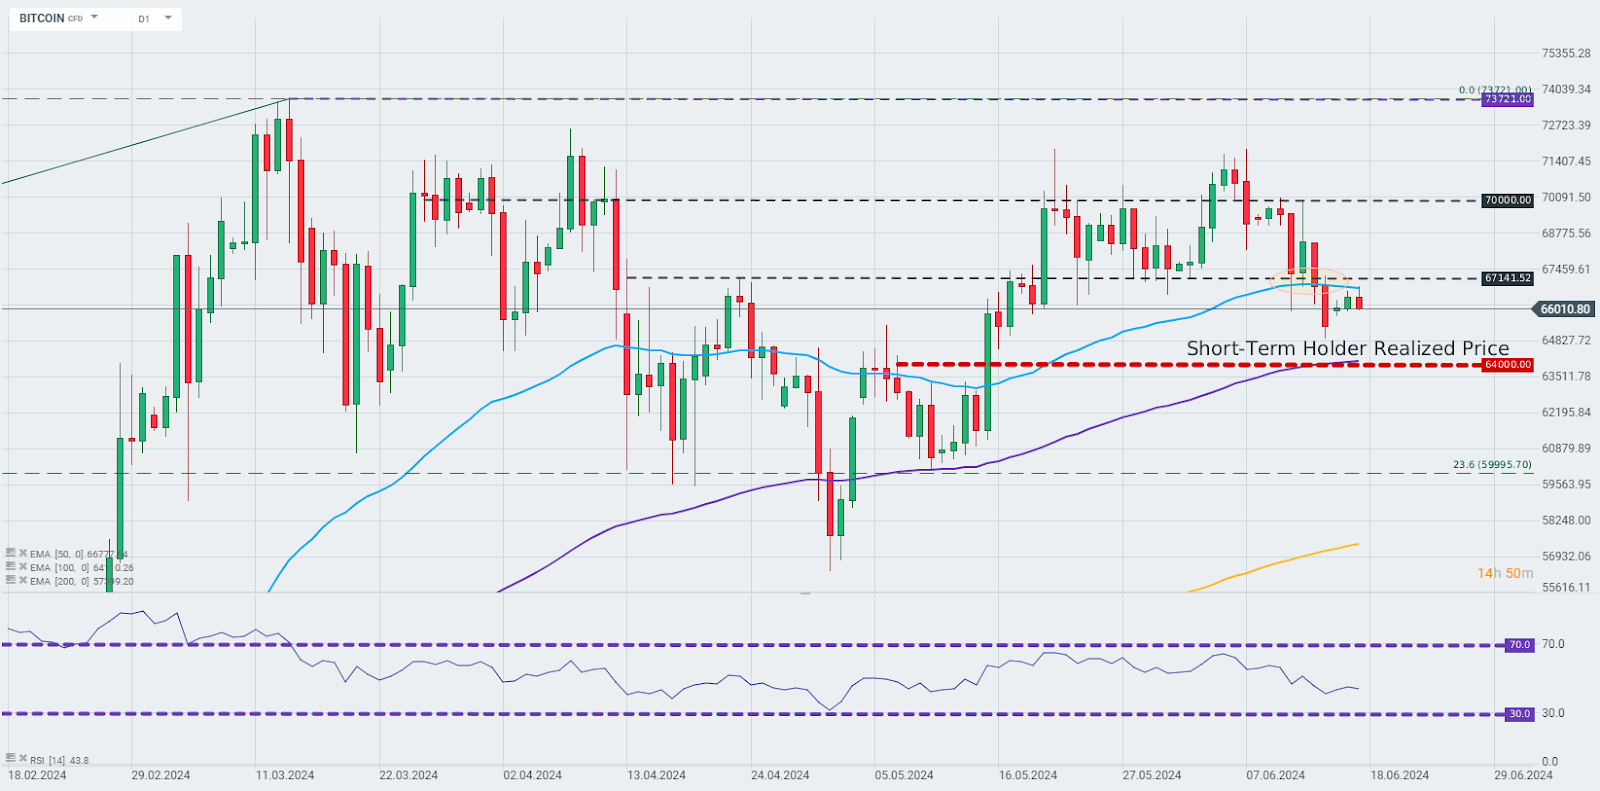
Bitcoin was unable to break above the barrier set by the 50-day exponential moving average (blue curve) and thus the cryptocurrency extended the downward wave. Source: xStation 5

🔼 Bitcoin jumps above $65k

Market Wrap: Geopolitical déjà vu. Hormuz once again in the center of investors' attention.

Daily Wrap: Technology Leads Wall Street Higher. Markets Shrug Off US–Iran Tensions

Morning Wrap It's getting hot in the Persian Gulf again, oil is back in the spotlight.