
Bitcoin is continuing a pullback with a strong downward move today. The most famous cryptocurrency has dropped over $1,000 this morning and is making a bearish break below the lower limit of the wedge pattern. The coin trades near a local low from January 13 at around $33,500. Should the ongoing downward move and high volatility continue, Bitcoin could look for a test of the support zone ranging above $30,000 handle. Investors question themselves whether reaching a fresh all-time high recently will be followed by a similar meltdown as it was the case back in the early-2018.
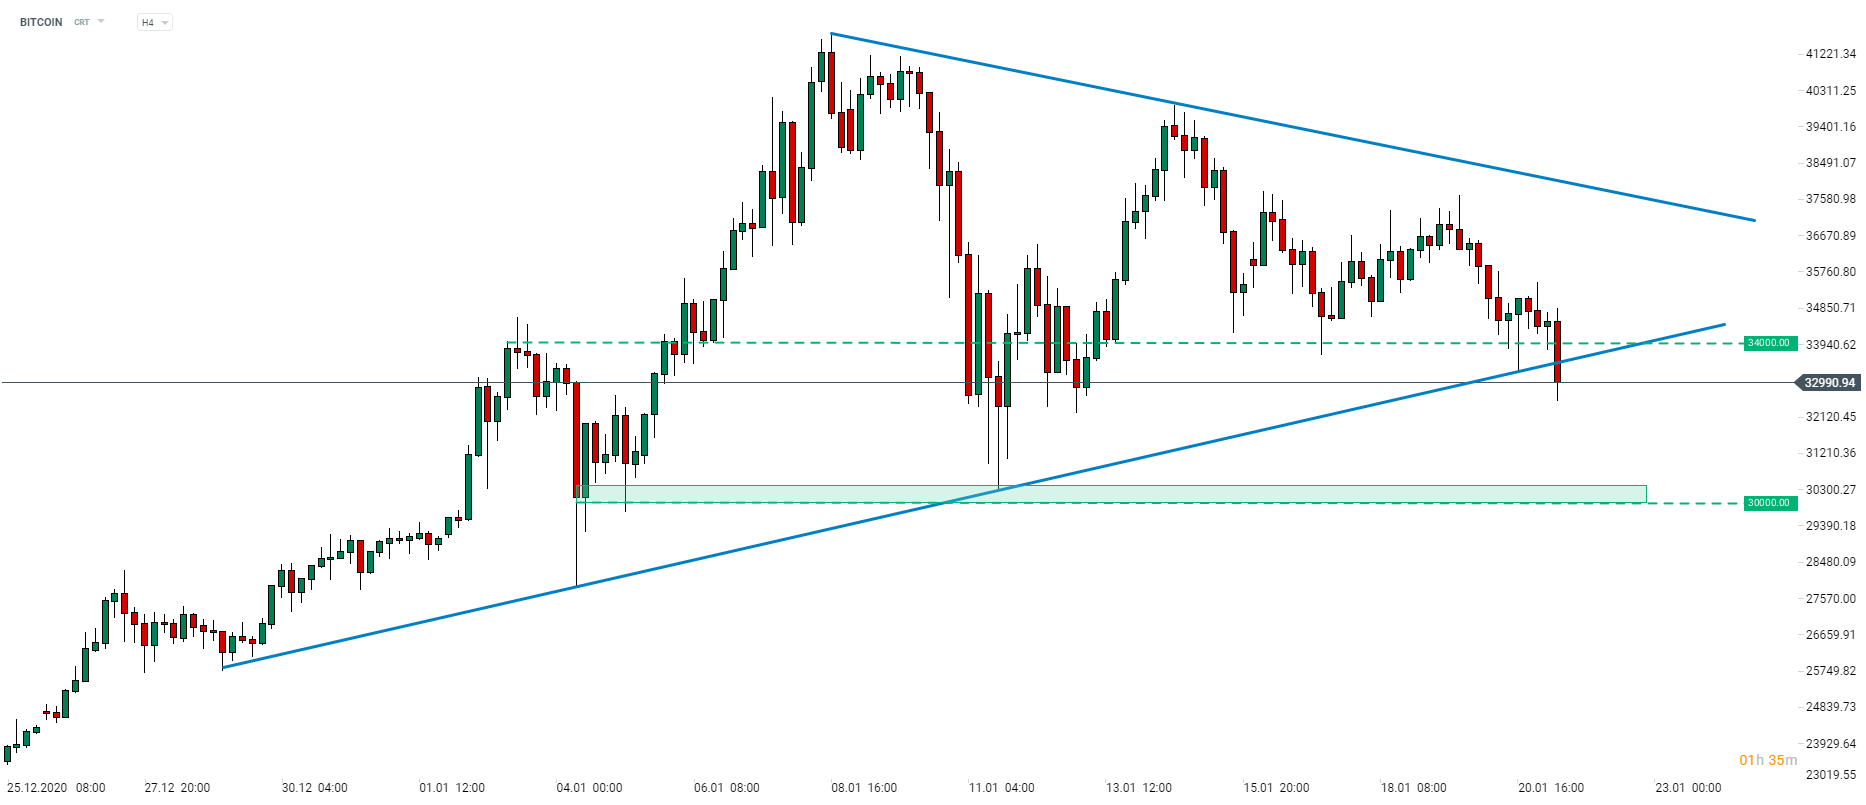 Bitcoin dives and makes a break below the lower limit of wedge pattern. Source: xStation5

Daily Summary: Chip War Weighs on Wall Street as Oil Plunges After US–Iran Ceasefire ⭐

Daily Summary: Trump's War Threats Weigh on Markets. Wall Street Sinks into the Red

Bitcoin Climbs Above $66,000 as ETF Flows Recover but Glassnode Warns of Higher Volatility

Morning Wrap: Oil Climbs Back Above $90 as Chinese AI Weighs on Tech Stocks.