Bitcoin has fallen by nearly 30% over the past month, and the drawdown from the all-time high near $126k has now reached roughly 50%. Does the technical setup justify optimism about a potential rebound? The latest bullish impulse failed to hold, with price facing strong selling pressure around $72,300 after bouncing about 20% from a local low.
- Sellers quickly regained control, triggering a multi-day consolidation range between $65k and $71k. Over time, that range produced two progressively lower highs, and the consolidation ultimately ended with another bearish leg that dragged BTC back toward the $63k area. As a result, Bitcoin is trading today only about 5% above the recent local low.
- If the previous downside impulse from October—followed by a weeks-long consolidation—serves as a template, we can assume that the upper boundary of the current corrective move may again align with the 38.2% Fibonacci retracement. That would imply BTC could still rebound toward roughly $74.3k before reaching a more “decisive” moment.
- That would represent an upside move of almost 20% from current levels. Looking back to the turn of November and December 2025, we can also see that price twice dipped back toward the correction’s local low (then around $80k). This suggests it is not guaranteed that the current decline must immediately transition into another sustained bearish impulse that could potentially push prices below $60k.
Overall, it seems the consolidation phase may take longer. A potential trigger for another sell-off could be renewed weakness on Wall Street and a resurgence in US dollar strength—although this trend still appears to be at a relatively early and uncertain stage.
Bitcoin (D1 timeframe)
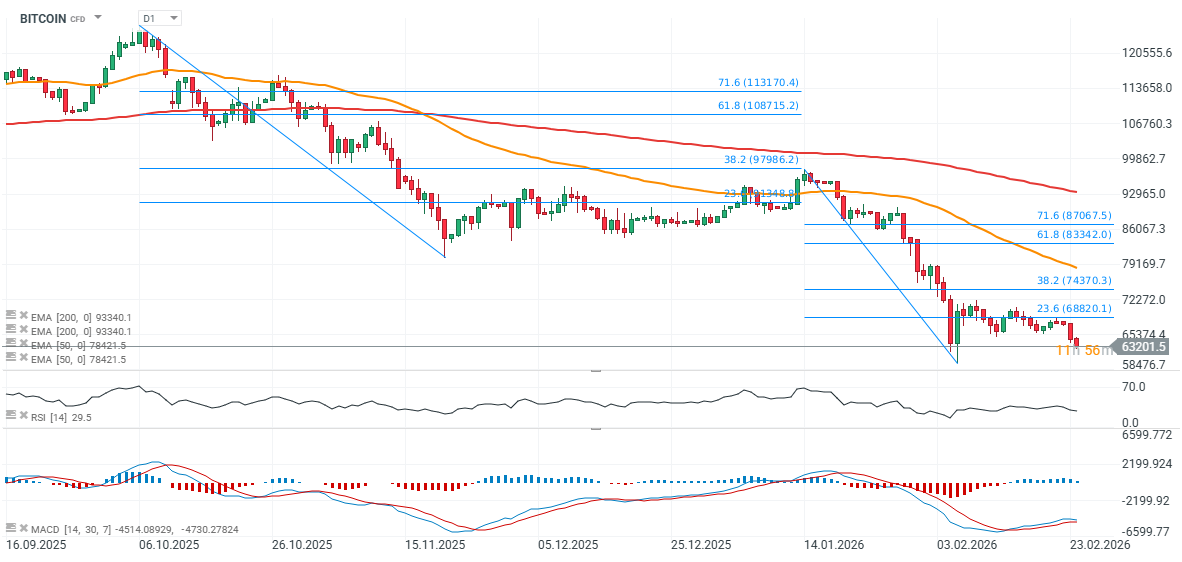
Source: xStation5

US OPEN: Semiconductors drive a rebound

Bitcoin Climbs Above $66,000 as ETF Flows Recover but Glassnode Warns of Higher Volatility
Market Wrap: Bulls Return to Europe Thanks to U.S.-Iran Mediation and Data from Germany

Silver breaks above $59 and attracts capital again. Gold remains in the shadow of its younger sibling