



Gold has delivered a strong upward move yesterday and has managed to break out of a trading range. Precious metal gained over 1.5% and pushed above the upper limit of the range at $1,755, that also marks the neckline of a double bottom pattern. Gold trades at the highest level since late-February and potential target of the breakout from trading range can be found at $1,830. Note that this level is also strengthened by the 78.6% retracement of the downward move started in late-January 2021. On the other hand, if bulls fail to sustain momentum, a pullback towards the aforementioned neckline at $1,755.
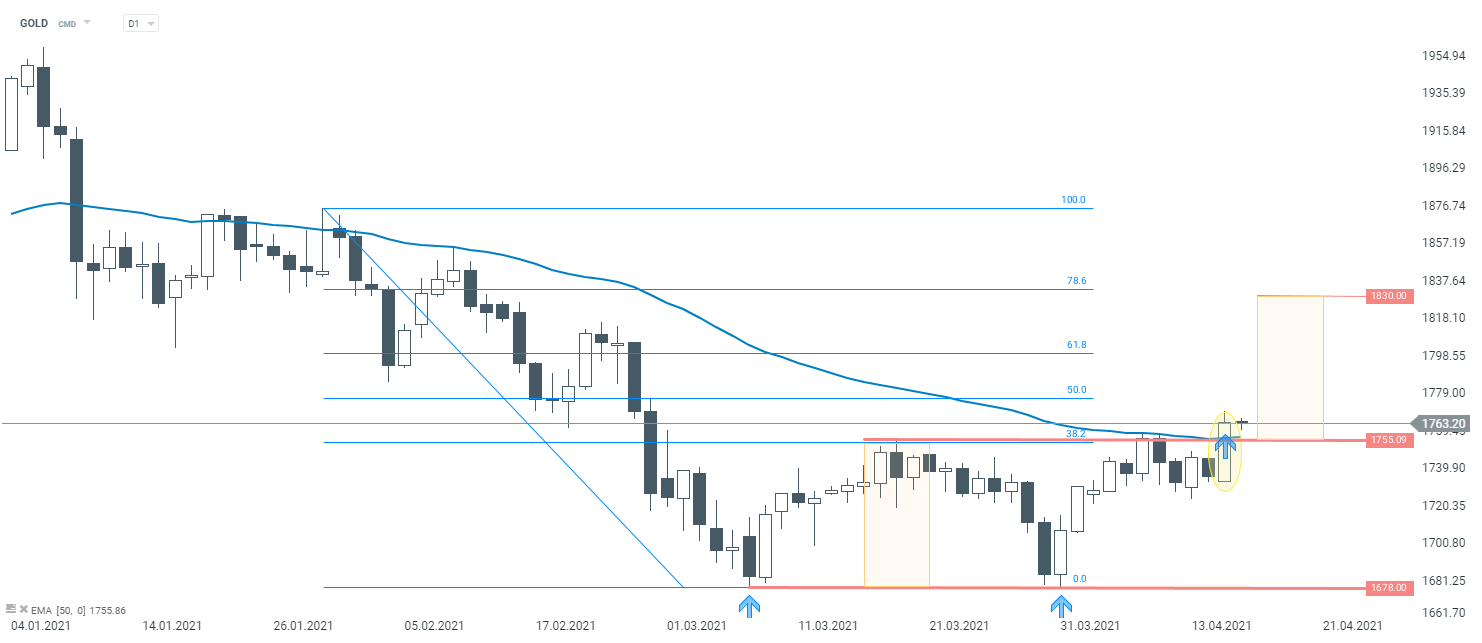 Source: xStation5



U.S. attacks on Iran suspended 💥



Market Wrap: A 4% surge in oil prices weighs on indices (08.10.2026)

Morning wrap: Wall Street and precious metals attempt to stabilize as oil gains nearly 2%


Daily summary: Wall Street recovers losses despite a surge in yields 🗽 Gold and silver retreat