
Wall Street indices went on a rollercoaster ride yesterday with a massive drop at the start of cash trading and even bigger reversal later on. However, upbeat moods did not extend into the Asian trading hours with major indices from the Asia-Pacific region taking a dive today. S&P/ASX 200 and Kospi dropped around 2.5% each, HSCEI moved 1.8% lower and Nikkei dropped 1.7%.
Taking a look at the Nikkei chart (JAP225) at a daily interval, we can see that the index continues downward move following a break below the lower limit of the symmetrical triangle pattern. Index reached a mid-term support zone at 27,000 pts today but failed to break below. Potential range of a breakout from the aforementioned pattern points 3,700-point drop. If the breakout is executed in a textbook manner, JAP225 could drop to as low as 24,050 pts area, just slightly above 23,600 pts support zone. This would mean dropping to the lowest level since November 5, 2020 and almost fully erasing the upward move launched following 2020 US presidential elections.
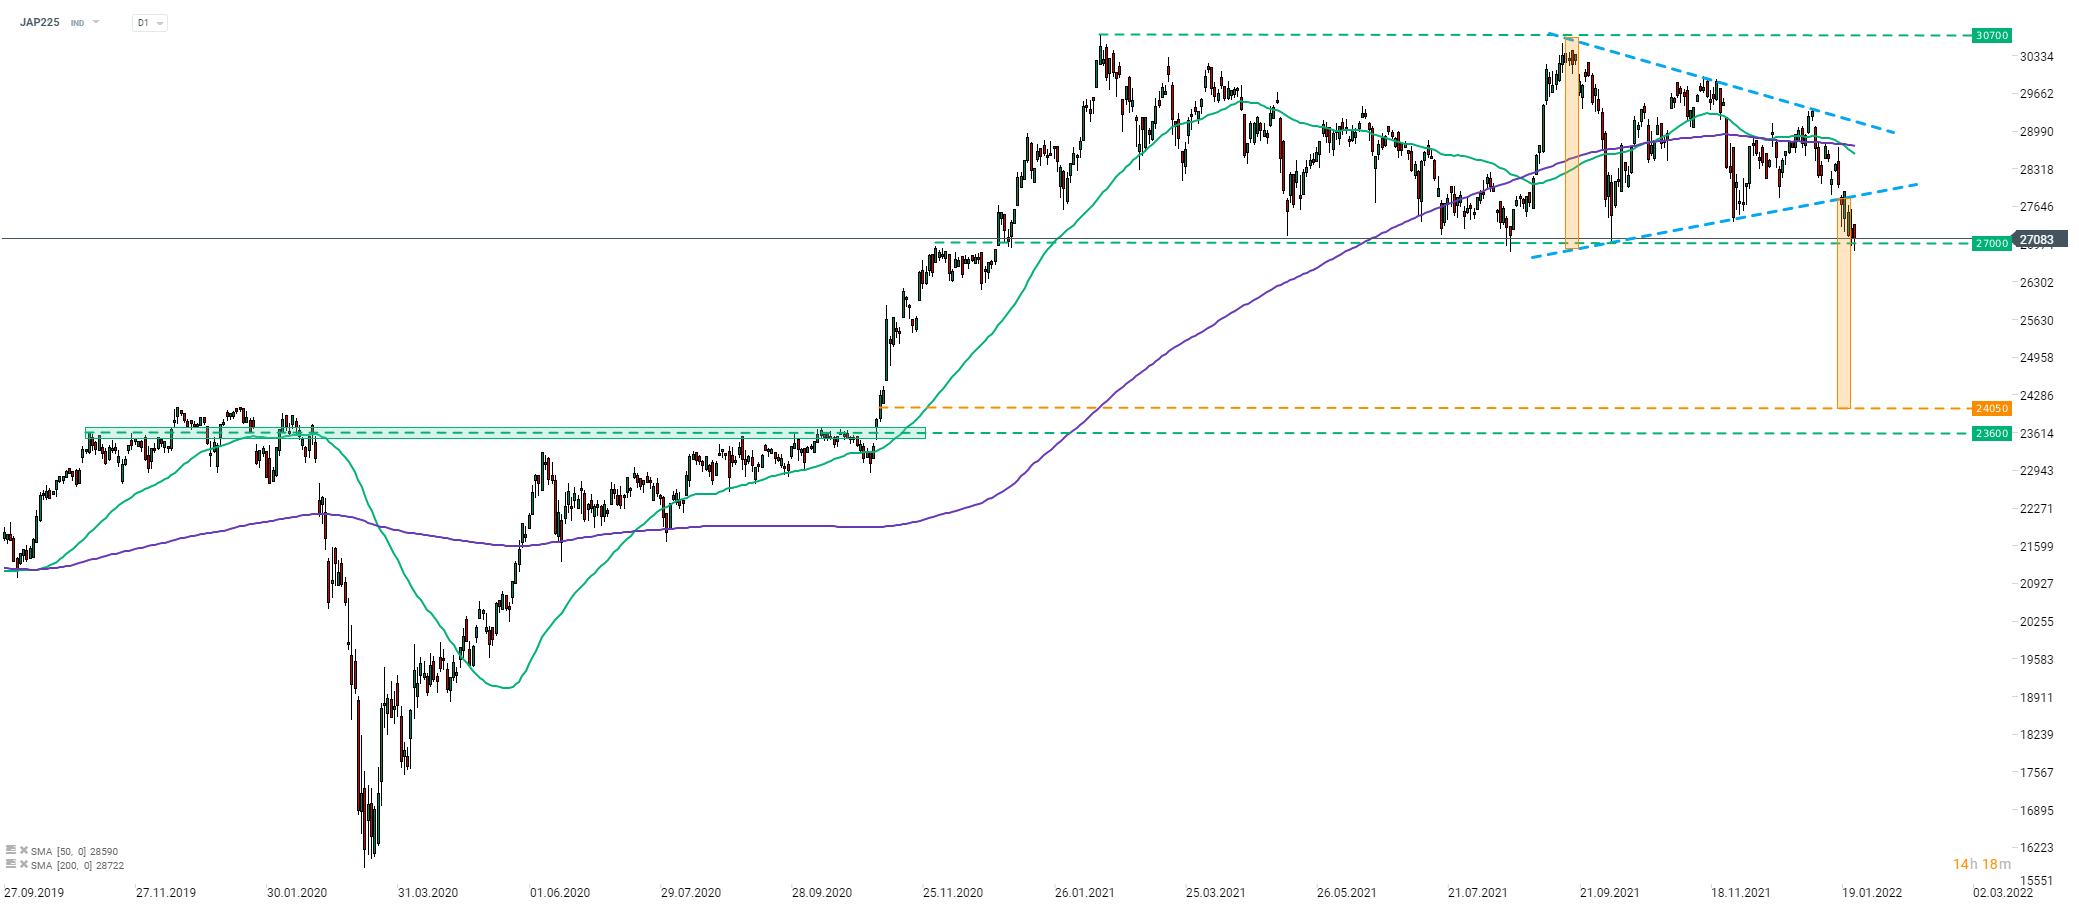 Source: xStation5

Daily Summary: Equities Diverge as Tech Lags, Europe Rallies on Earnings & PMIs (24.07.2026)

Three markets to watch next week (24.07.2026)

US OPEN: Nasdaq hits 1-month low! Geopolitics bring AI trade down!

Market Wrap: European Stocks Are Trying to Rebound as the Week Comes to an End💡