



WTI crude futures traded near $88.00 per barrel on Thursday, having rallied more than 10% so far this week as OPEC+ agreed to cut output by 2 million barrels per day, the biggest output cut since the start of the pandemic. Yesterday the price broke above the major resistance zone around $87.60, which is marked with upper limit of the local 1:1 structure, downward trendline and 61.8% Fibonacci retracement of the upward wave launched in December 2021. As long as price sits above this level, upward move may accelerate towards next resistance at $92.75.
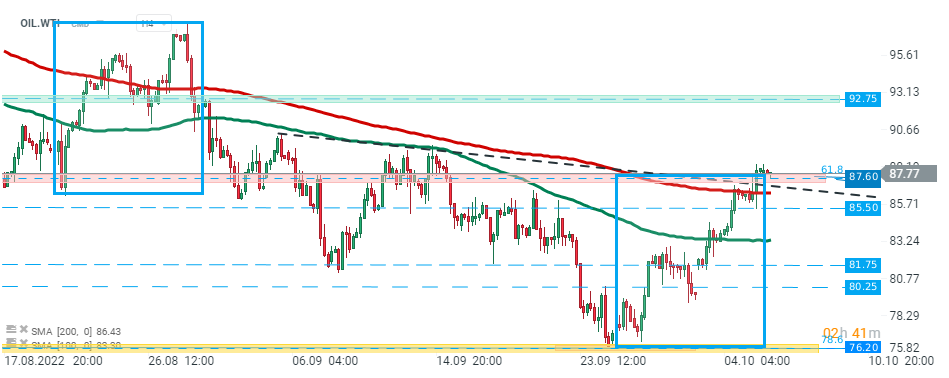 OIL.WTI, H4 interval. Source: xStation5



Daily Summary: Friday offers no relief; the US100 drops 2%🚨


Three Markets to Watch Next Week (October 16, 2026)


Chart of the Day: NATGAS - Are there chances for a seasonal rebound amid warm weather?


Morning Briefing: Warsh's silence on interest rates. AI debt fears cooled sentiment, but a rebound is visible