
Rally on the energy markets have taken a pause, following comments from the Russian President yesterday. Putin said that Russia is ready to increase supply of natural gas in order to stabilize energy markets. More positive news came from the United States, where the US Secretary of Energy said that oil from strategic reserves may be released in order to lower prices while a ban on oil exports is also an option. As a result, oil and natural gas pulled back from recent highs. However, whether it is just a brief correction or a trend reversal remains to be seen.
A look at the WTI chart (OIL.WTI) shows that this grade of crude is currently trading at a very interesting level. OIL.WTI is testing the $76.00 per barrel area, which is marked with the lower limit of a market geometry (largest correction in the current upward impulse). A break below this area would, in theory, hint at a reversal of short-term trend. In such a scenario, the first near-term support to watch can be found at the $73.75 price zone.
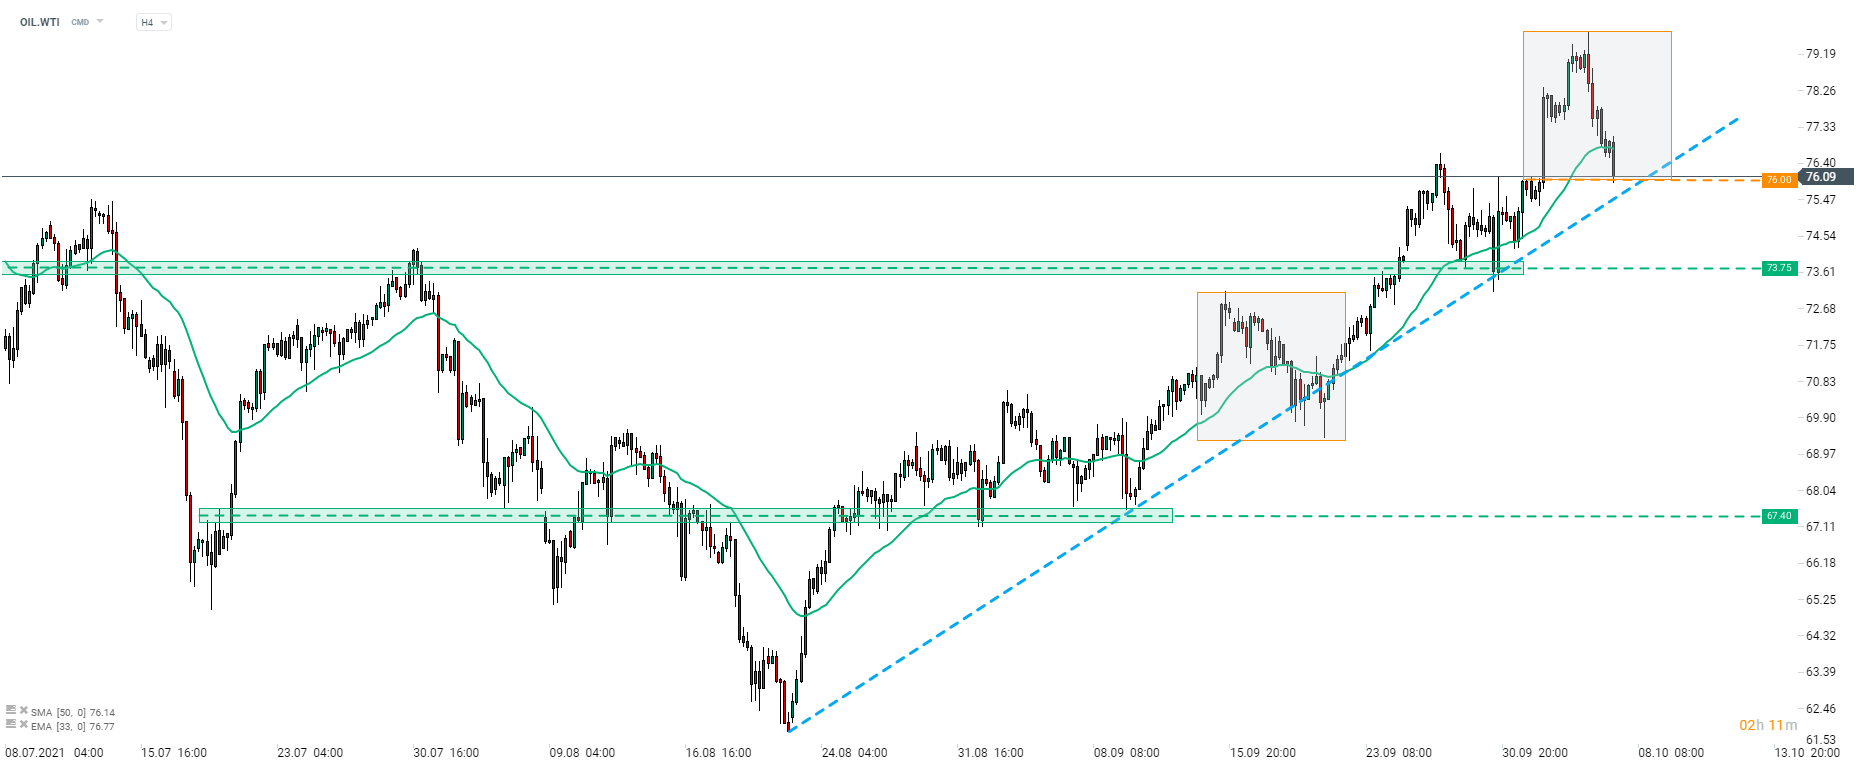 Source: xStation5

Daily Summary: Trump's War Threats Weigh on Markets. Wall Street Sinks into the Red
Tensions around Iran weigh on markets!

Wheat climbs to the highest level since May 2024 🚜 Black Sea export risks fuel rally

Oil rises over 3% 🛢️